.svg)
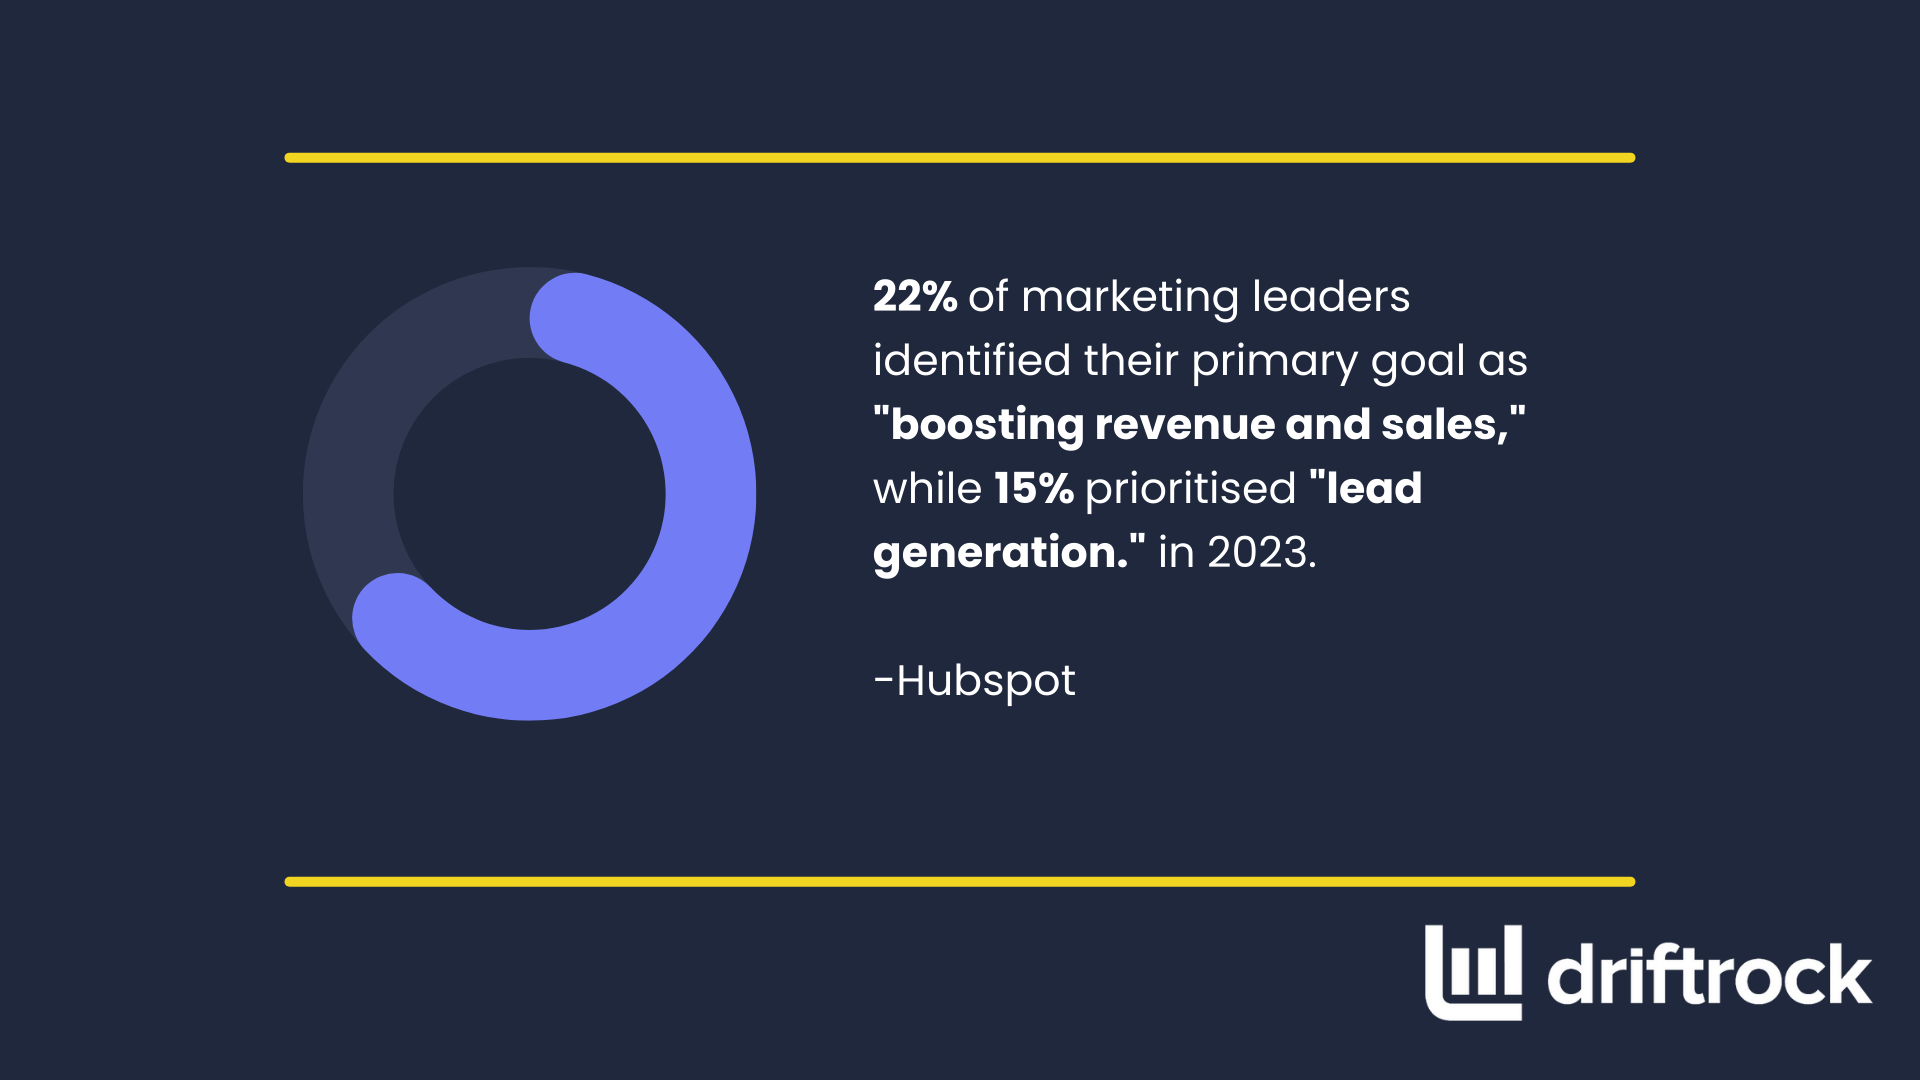
The first step to building any successful marketing strategy is to set a relevant goal. According to recent research by Hubspot, 22% of marketing leaders identified their primary goal as "boosting revenue and sales," while 15% prioritised "lead generation." in 2023.
As the era of cookies comes to an end, an increasing number of businesses are turning their focus on collecting quality leads by leveraging zero-party and first-party data through strategic lead-generation efforts.
But how do you know if your lead generation efforts are successful?
It is important to track and analyse your lead generation metrics to measure the success of your sales and marketing efforts.
Moreover, it is also essential to measure the right lead quality metrics that align with your business objectives. By focusing on the most relevant lead generation KPIs (Key Performance Indicators) for your business, you can refine your current lead generation strategy and enhance your overall Return on Investment (ROI).
Here at Driftrock we firmly believe that "You can't optimise what you don't measure!"
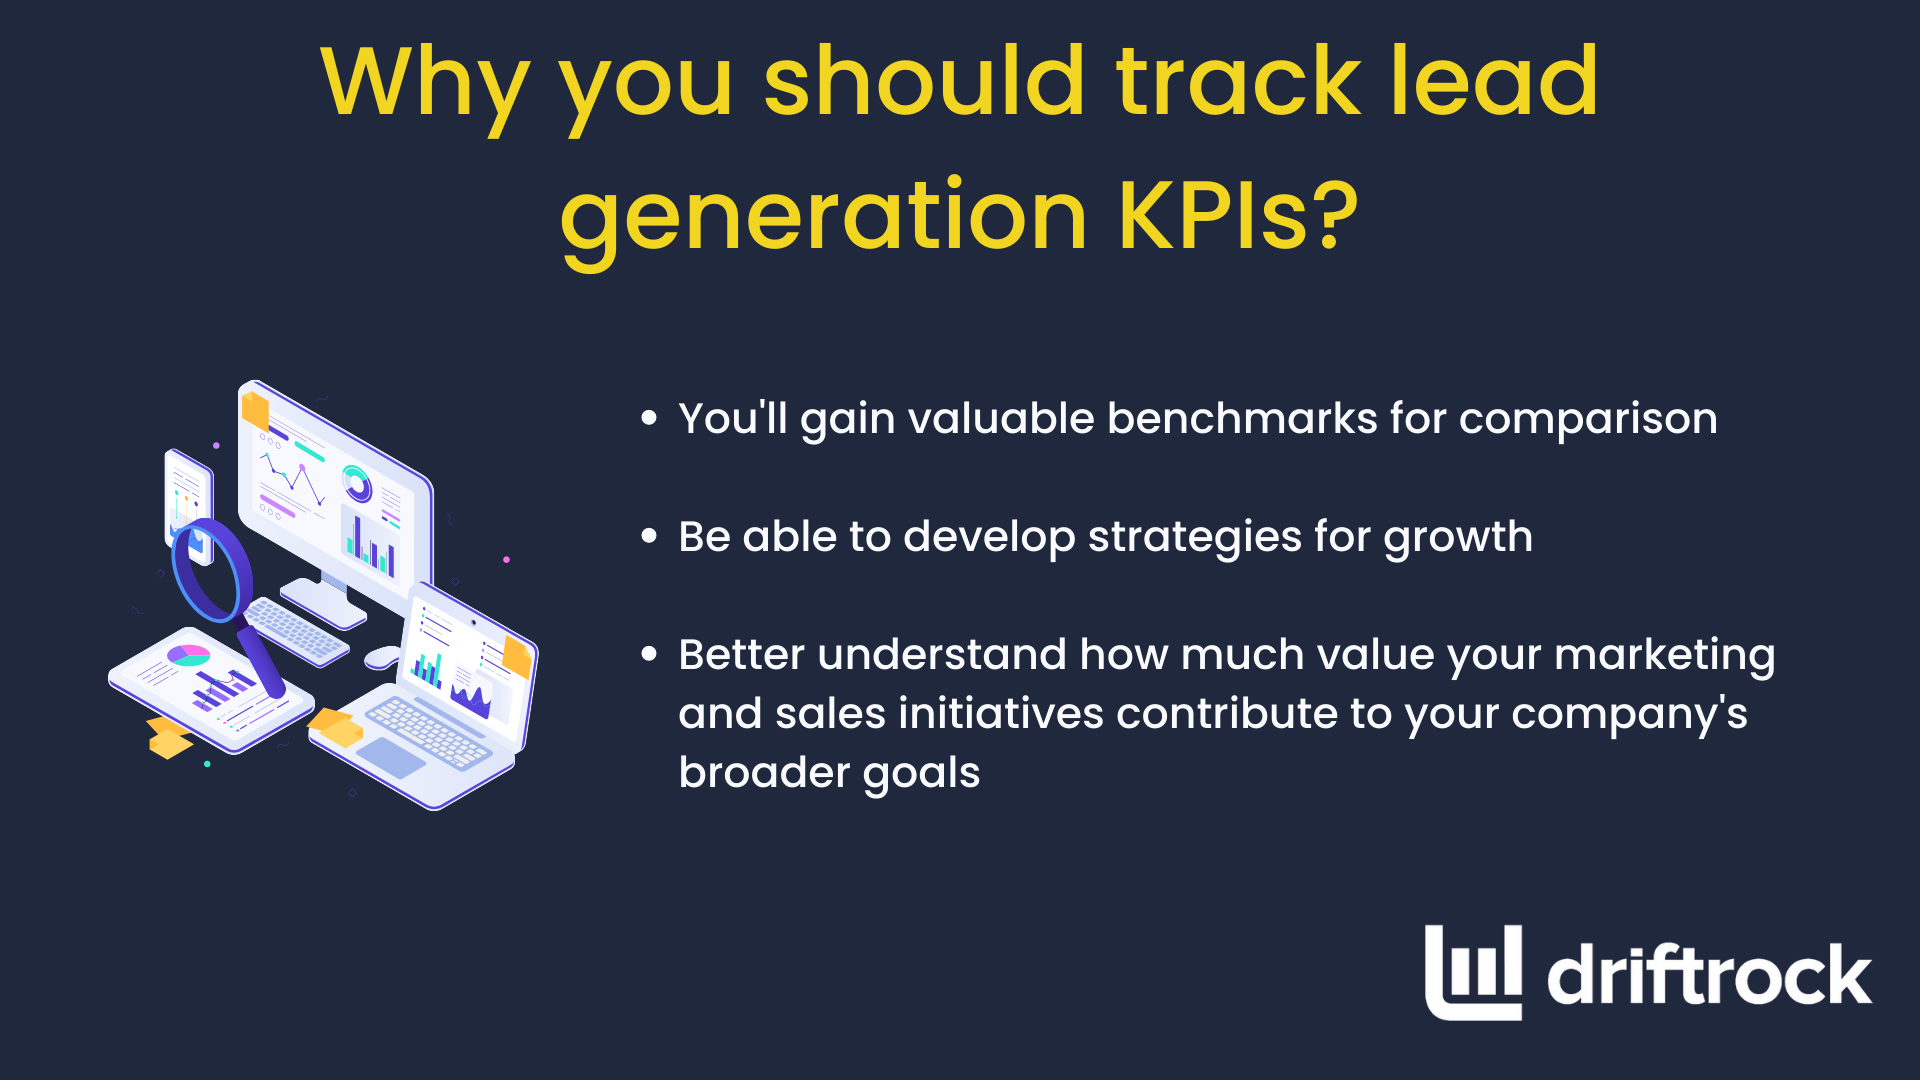
By tracking these vital metrics:
- You'll gain valuable benchmarks for comparison
- Be able to develop strategies for growth
- Better understand how much value your marketing and sales initiatives contribute to your company's broader goals
We've put together this comprehensive guide to help you pinpoint the most effective metrics for measuring the success of your lead generation campaigns.
How do you identify the right lead generation KPIs for your business?
In order to figure out what are the most suitable lead generation performance metrics for your business, it's crucial to thoroughly examine your marketing and sales funnels from beginning to end.
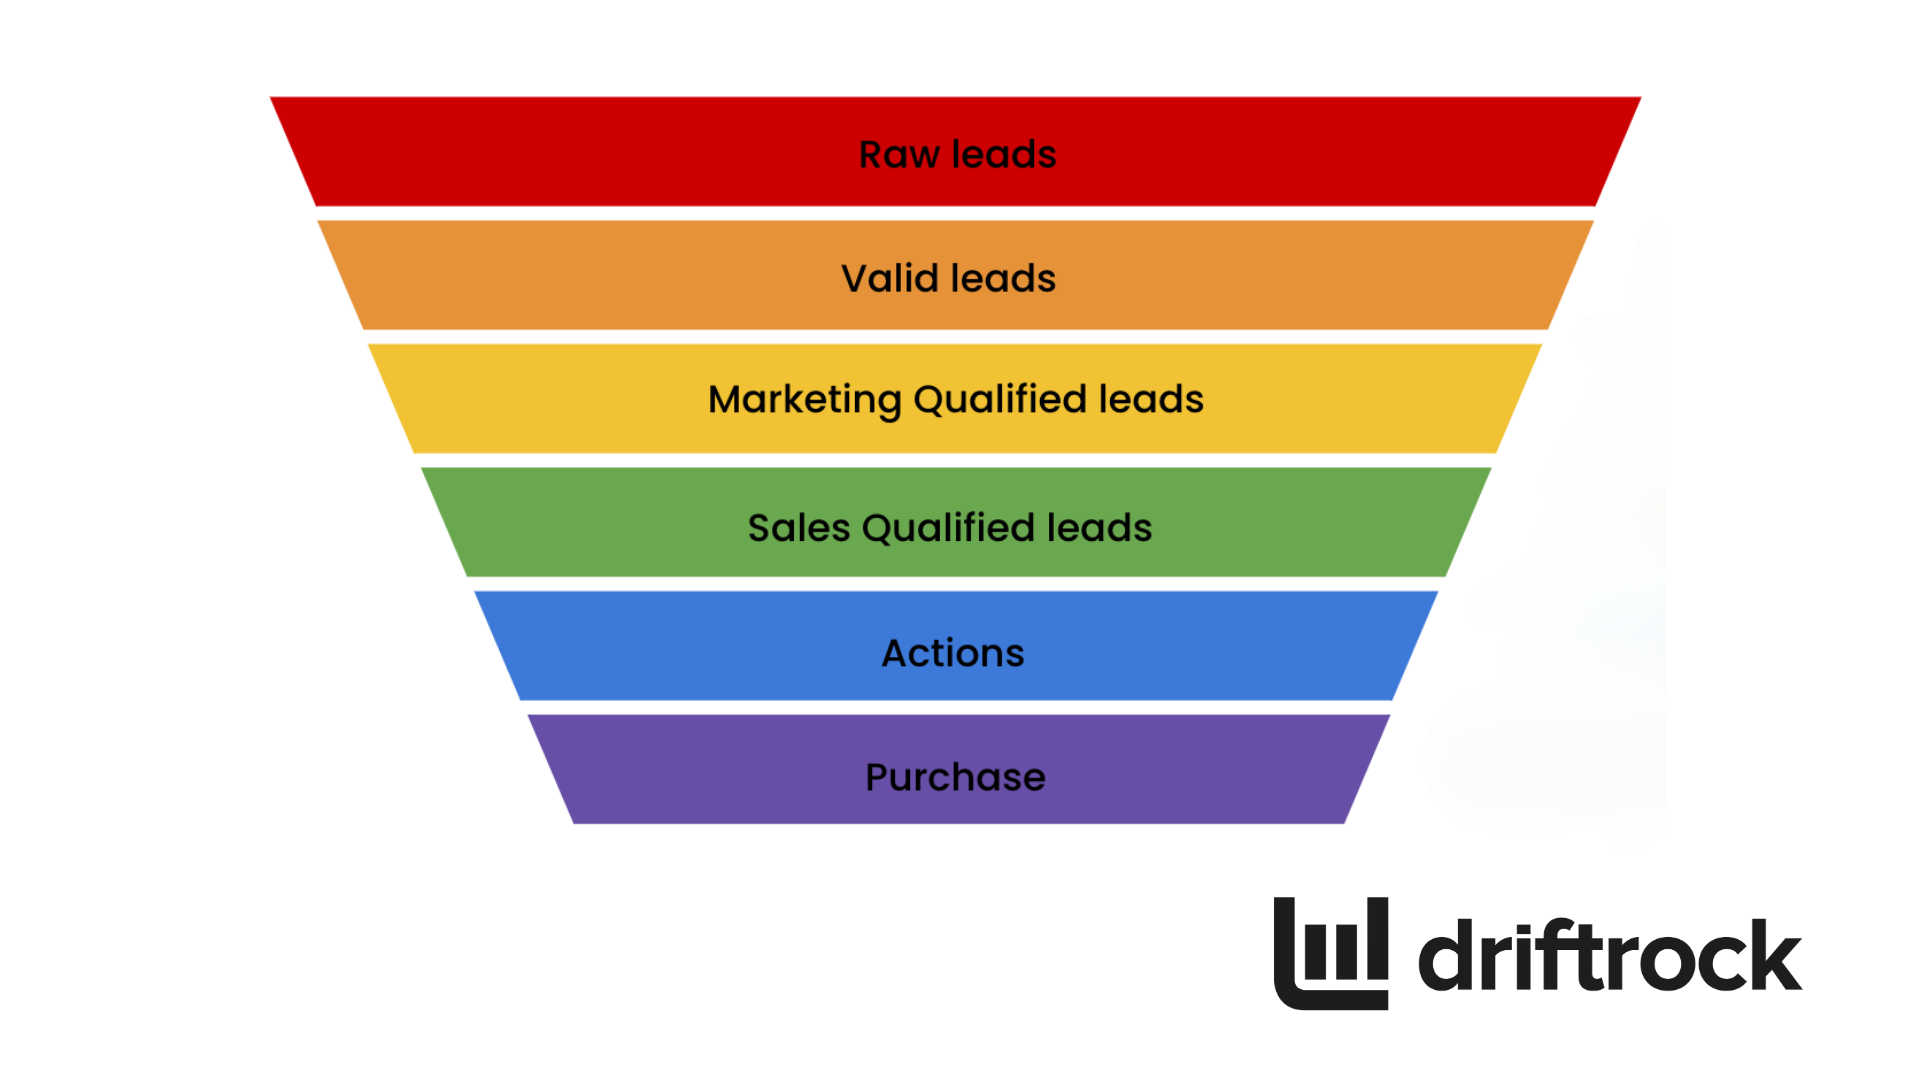
Typically, these funnels encompass the following stages:
- Leads - all the leads generated from different marketing sources
- Valid Leads - leads with accurate and valid information (phone numbers, emails, addresses)
- Marketing Qualified Leads (MQLs) - leads vetted by the marketing team
- Sales Qualified Leads (SQLs) - leads approved by the sales team
- Actions - Steps taken on your website or within your application (for example, beginning a course or starting a trial)
- Conversions and Purchases - Instances where customers convert or buy your products or services
Remember, you can customise each key metric to align with your unique sales funnel and definitions, ensuring the most relevant insights for your business.
Once you have analysed your current marketing and sales process, you can start determining your new lead generation KPIs.
Let's look at some of the key metrics you should focus on!
The Ultimate KPIs for Lead Generation
We have divided the lead generation KPIs into two sections:
- Metrics related to leads
- Metrics related to cost
First, let's talk about key metrics related to leads.
1. Number of Leads
These are all the leads generated by your business from different sources. You will also need this metric to calculate other important lead generation metrics and KPIs.
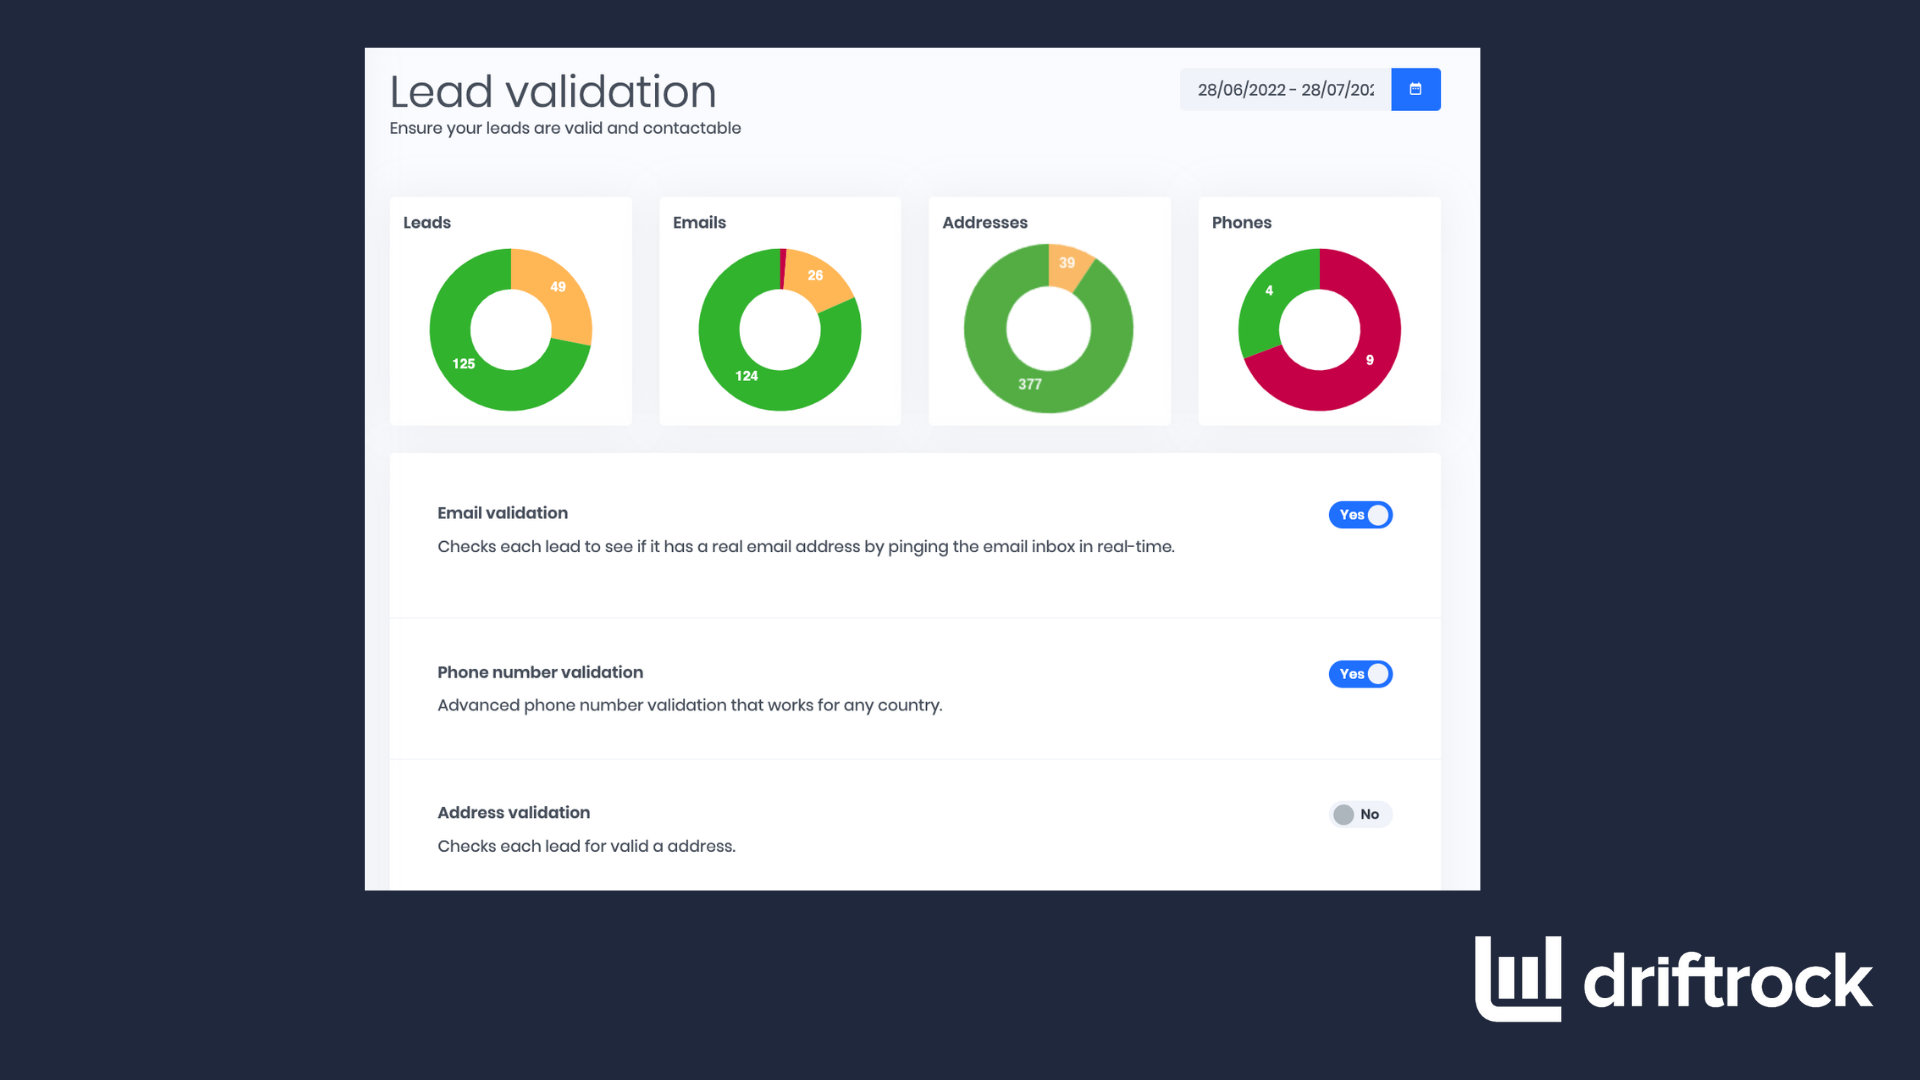
2. Valid Leads
Out of all the new leads generated, the leads that shared their actual information instead of fake or invalid information.
You can use a tool like Driftrock to automate this task. Driftrock can filter out valid phone numbers, email IDs and addresses automatically in real time. You can use this feature just for reporting purposes or stop this data from entering your CRM systems, saving resources and valuable time of your sales team.
3. Marketing Qualified Leads (MQLs)
The Marketing Qualified leads (MQLs) are leads who have shown a certain level of interest by answering questions in the lead form or taking certain actions such as downloading a whitepaper, signing up for a webinar, or subscribing to your newsletter. They are qualified by the marketing team.
These leads fit your target audience and have a higher potential for conversion.
4. Sales Qualified Leads (MQLs)
An SQL, or Sales Qualified Lead, refers to a potential customer who has gone through the marketing funnel and is now ready for direct sales engagement.
This means that they have met specific criteria, such as having the right budget, authority, and need for your product or service, as well as expressing a clear intent to buy.
Apart from the basic lead-based metrics, there are also some crucial cost metrics and revenue-related metrics. They are:
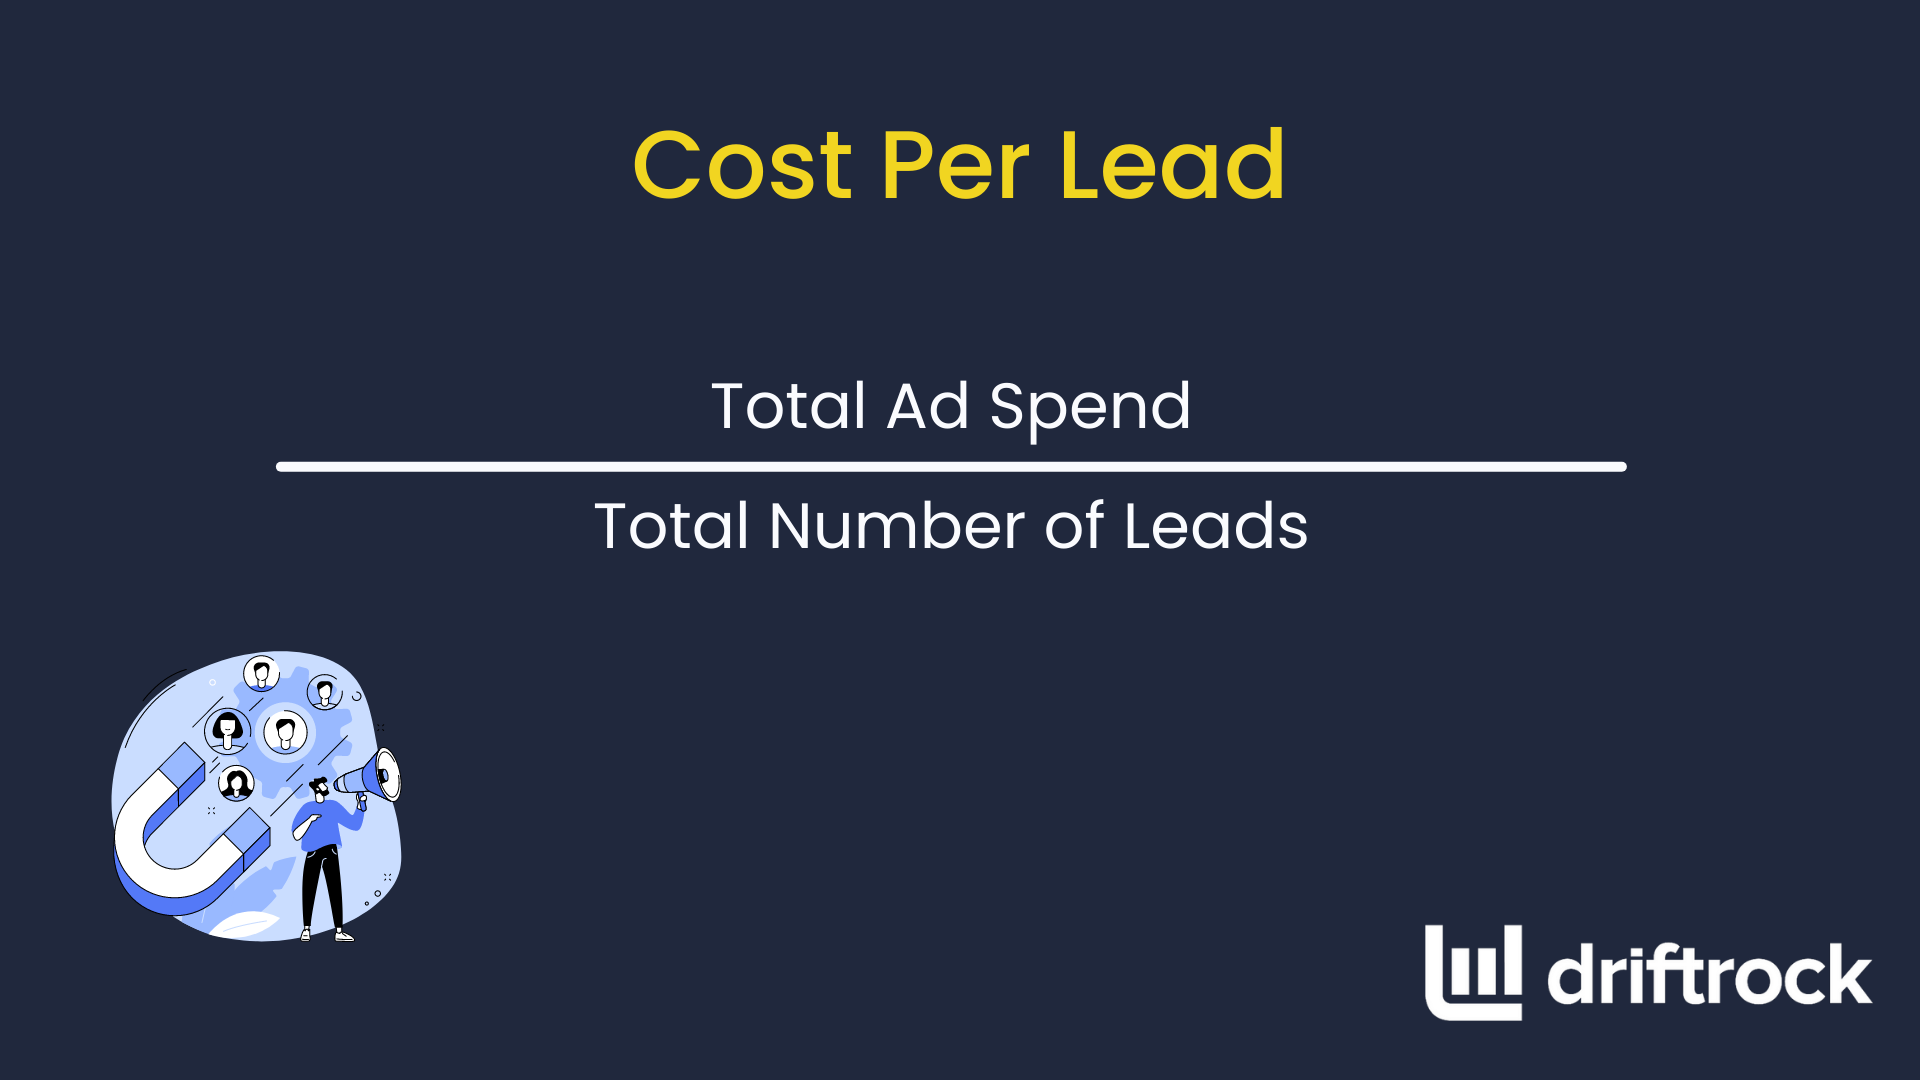
5. Cost per lead (CPL)
Your CPL (cost per lead) metric calculates the average cost associated with generating a single lead, allowing you to assess the efficiency of lead cost in your marketing initiatives.
This can help you gain valuable insights to ensure you get the most out of your money.
You could take this a step further and even focus on cost per marketing qualified or sales qualified lead.
Formula: total spend/total number of leads
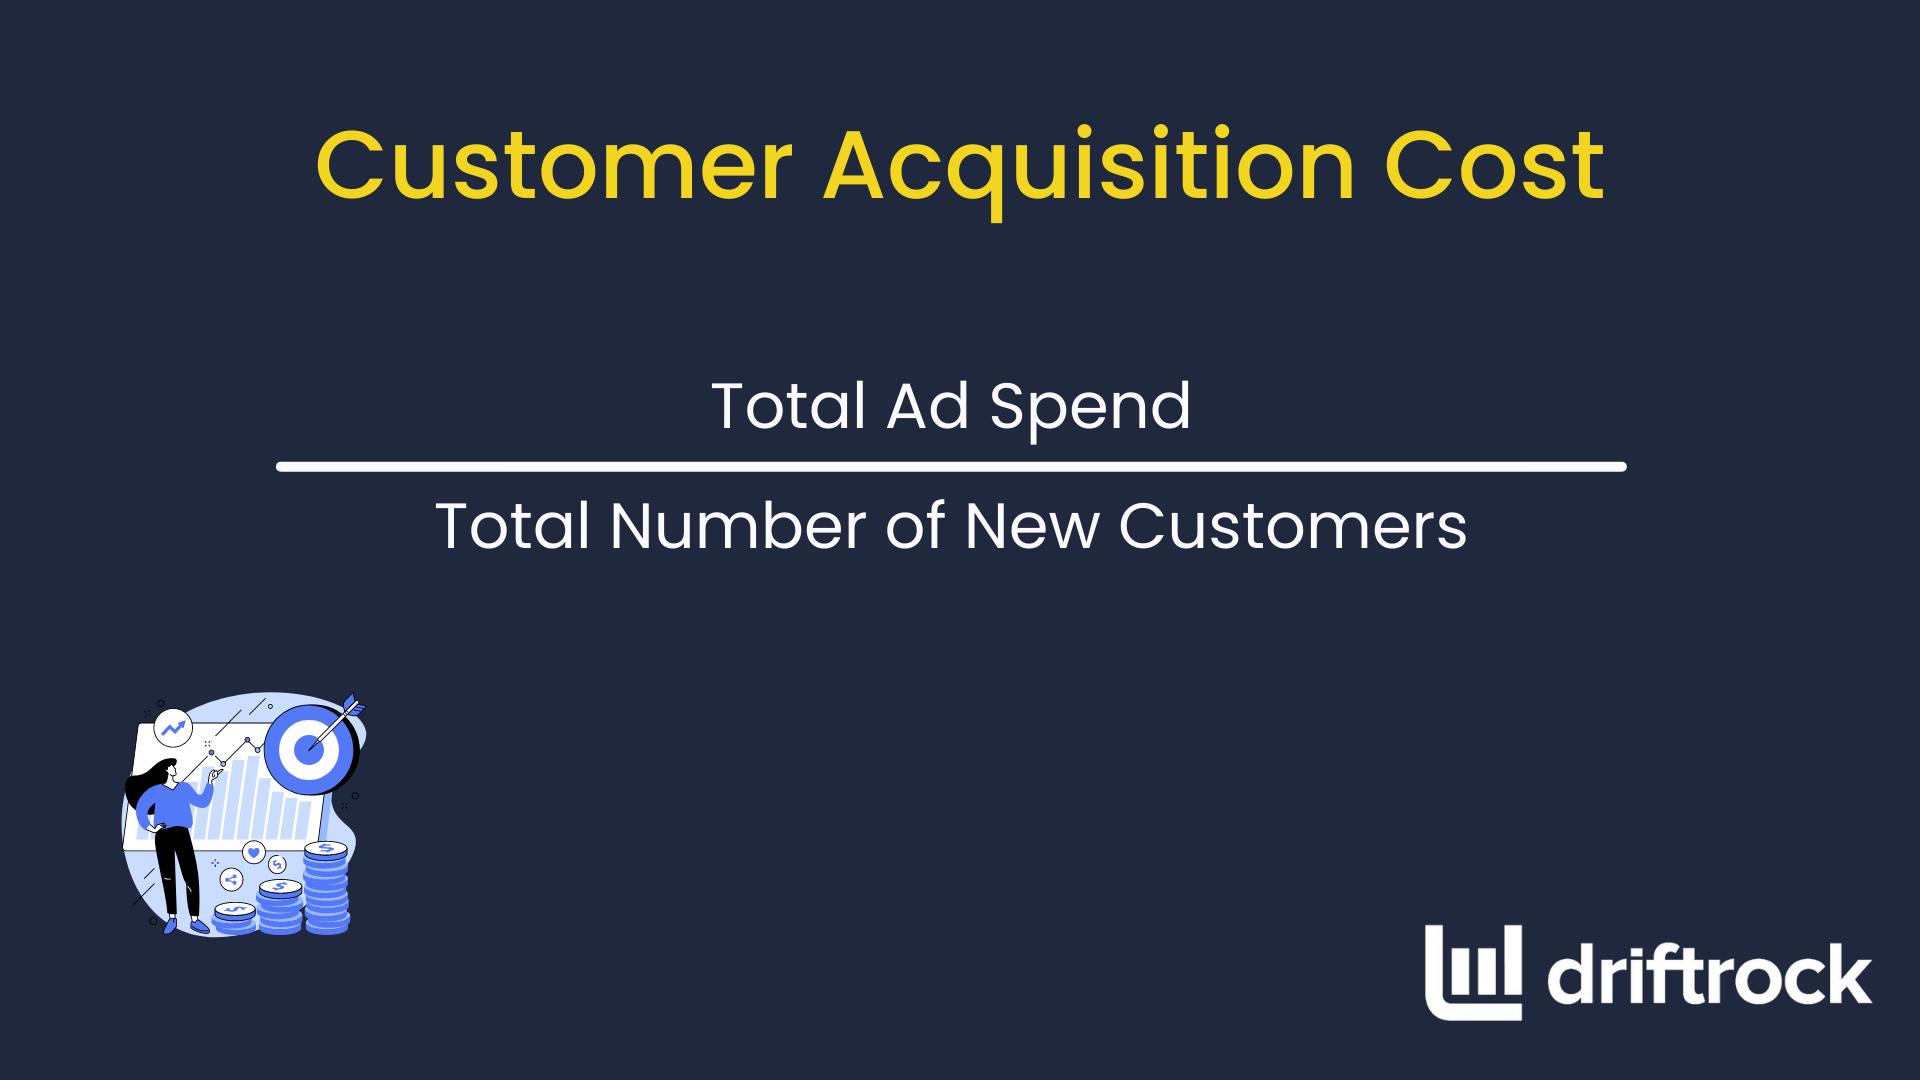
6. Customer Acquisition cost (CAC)
Another essential KPI to understand the true value of your lead generation efforts, the Customer Acquisition Cost (CAC) is a KPI you can't afford to overlook.
CAC represents the average amount of money spent on marketing and sales efforts to acquire a new customer.
This metric helps you stay on track with your budget and ensure you are driving sustainable growth. The lower the Customer Acquisition Cost, the better!
Formula: total ad spend/total number of new customers
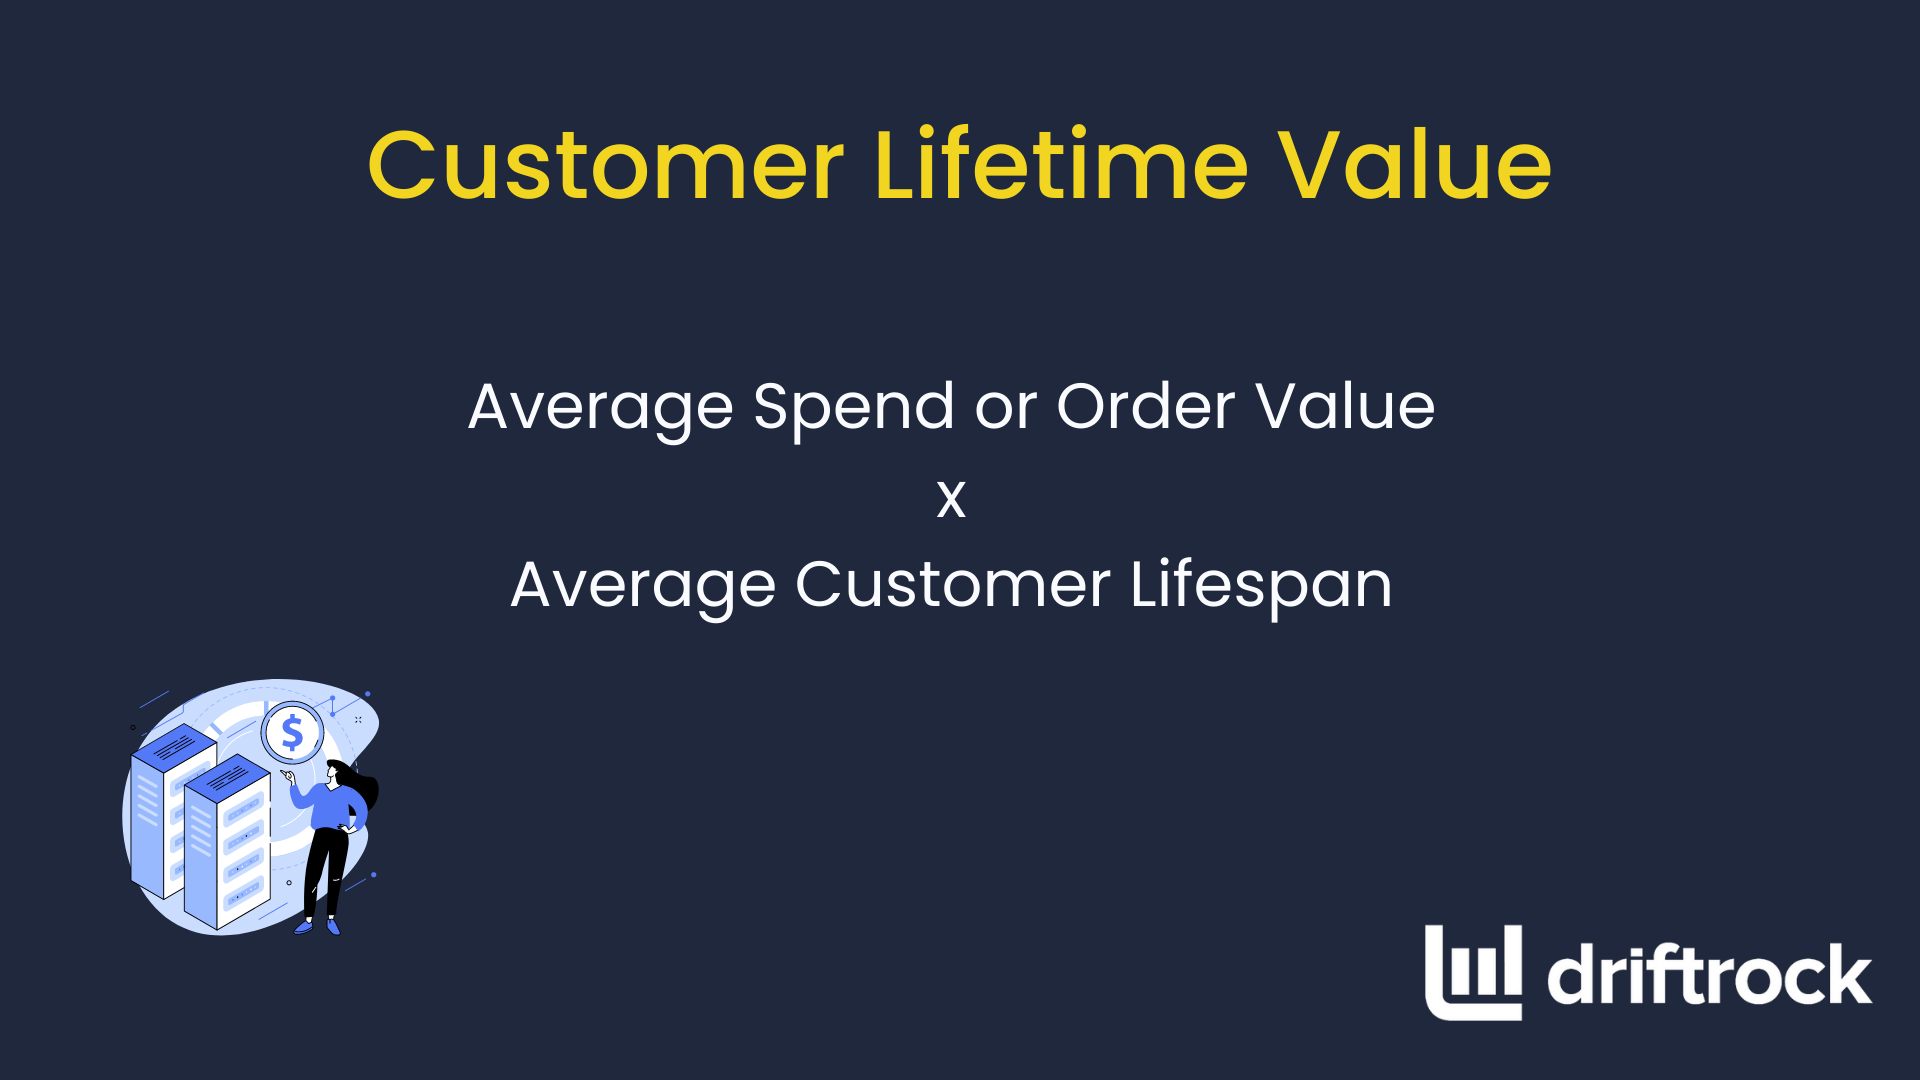
7. Customer lifetime value (CLTV/CLV)
Customer lifetime value is the lifetime value or revenue a customer will bring to the business during the span of the relationship.
It is a good indicator for your revenue forecast and to understand what should be your ideal Customer acquisition cost (CAC).
Formula: average spend or order value*average customer lifespan
8. Return on Investment (ROI)
We believe this should be the "North Star" metric of your marketing and sales teams.
This vital KPI represents the ratio between the net profit generated from your marketing efforts and the total cost of those efforts.
The higher the Return On Investment, the more effective your lead generation strategies are in terms of profitability.
By closely monitoring your ROI, you can make data-driven decisions.
Remember, optimising your ROI doesn't just benefit your bottom line—it also means delivering greater value to your customers and building lasting relationships.
Once you start tracking these lead generation KPIs, it is time to use the data to gain a competitive edge and improve your lead generation strategy.
How to improve your lead generation game?

Attribution Channels
While successfully tracking these metrics, you should also track the "marketing attribution" (marketing channels). Track where each lead comes from and how they go down the sales funnel. You should track and break down the entire funnel by:
Marketing Mediums and Lead Generation Channels
If the lead was generated via paid marketing, organic marketing, email marketing, direct, referral, etc.
Additionally, if the lead generated was from Facebook, Google, LinkedIn, etc.
Marketing Campaigns
Identifying the specific campaign on that platform which generated the lead
Marketing Ads, Audience, Forms and Keywords
Depending on the channel and set up you can further define and track additional marketing attributes and variations such as the ad, creative, target audience and keywords.
Once you have the full funnel data along with costs and marketing attribution, you can truly start analysing and optimising your marketing efforts to get the best ROI (Return on Investment) possible.
- You can maximise your marketing budget to ensure your resources are directed towards the most impactful lead generation efforts.
- You can optimise your marketing channels and campaigns, helping you fine-tune your lead generation strategy for long-term success.
- You can make informed data driven decisions about where to allocate your marketing budget and identify areas where you can improve efficiency, ultimately leading to more successful lead generation campaigns.
To make data driven and impactful lead generation improvements, it is necessary to focus on not just the number of leads but qualified leads or quality leads, that generate revenue.
For example, let's assume there are two campaigns: Campaign A and Campaign B with the following metrics:
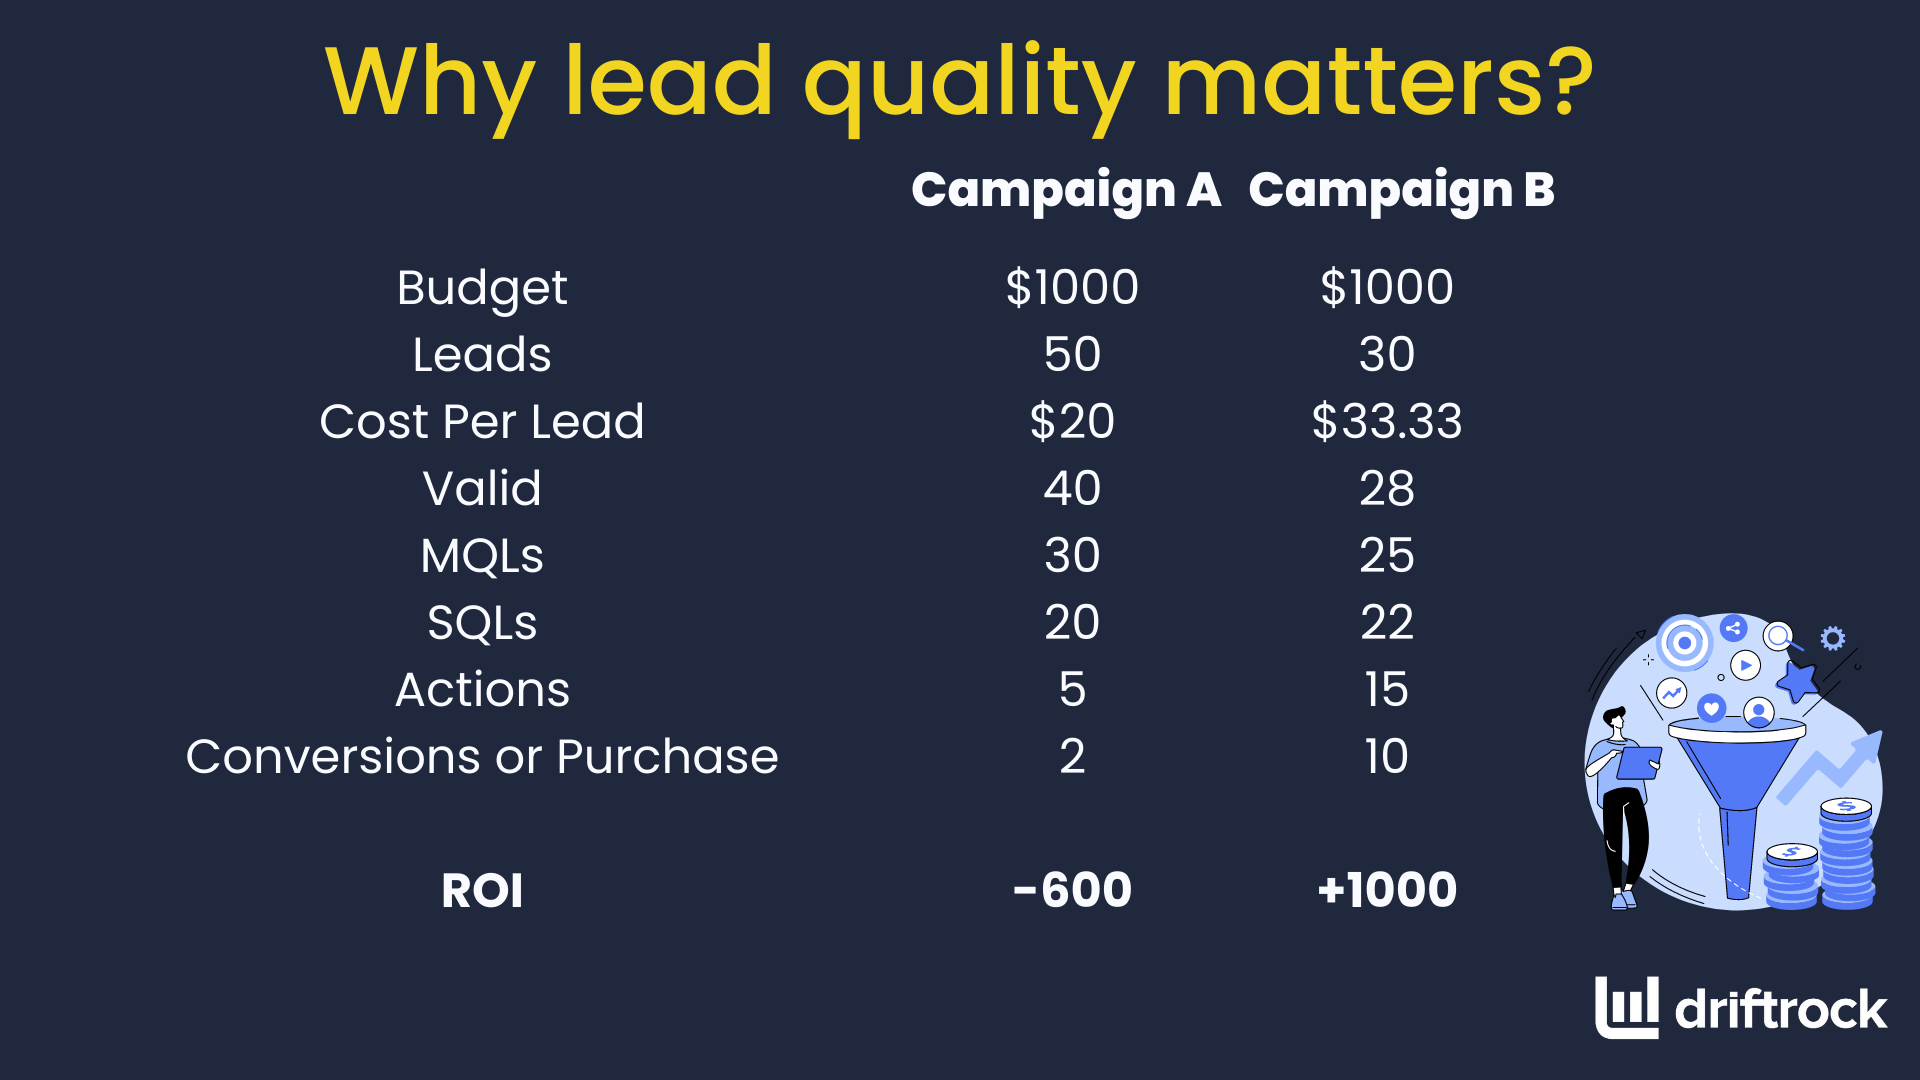
Let's assume you make $200 per sale. So in Campaign A, you would be in -$600 (loss) whereas, in Campaign B, you would make a +$1000 (profit).
If you only track the number of leads or other high-level metrics you may think campaign A is more successful with better performance. However, campaign B is bringing in more qualified leads with higher ROI and business growth.
Conversion Rate
Track the conversion rate between each important lead generation KPI to find out what you can work on. For example, if the conversion rate between Leads > Valid or Qualified leads is high but Valid or Qualified leads > Sales Qualified leads is low, you can focus on improving the conversion rate for sales qualified lead.
Keeping it simple and focused
Another key thing to remember is not to overcomplicate by trying to track each and every metric. There are many marketers who spend hours trying to track each and every bit of information.
Some of those metrics might be the average session duration, bounce rate, website traffic, tracking engagement etc.
Don't get us wrong, these lead generation metrics are still useful and you should keep an eye on them for major changes and what is affecting those changes. However, you should try to automate tracking them and focus on other lead generation KPIs more.
Modelling/Forecasting
Once you start tracking these metrics for a while, you have some benchmarks for all your important lead generation metrics. This could help you forecast and plan your marketing budgets and revenue. You could set up a simple Google Sheet or Excel Sheet to get started.
How to track your lead gen KPIs automatically using Driftrock

As marketers, it can be easy to overcomplicate things and lose sight of the big picture or what really matters. It can also be time-consuming and frustrating to track your lead generation KPIs from different marketing sources and marketing campaigns to the details that really matter - conversions.
Using Driftrock, you can automate and connect multiple lead generation sources. Enable downstream tracking to get all the details in your Driftrock dashboard.
To access and customise your reports in Driftrock, follow these simple steps:
- Sign in or create a new Driftrock account.
- Choose "Reporting" from the left-hand navigation menu.
- Click the "Add Chart" button and follow the on-screen prompts.
- Select your preferred chart type, such as Funnel, Pie Chart, Scorecard, Table, or Time series.
- Adjust the settings as needed and click "Save" to finalise your changes.
It's time to automate these tasks so you can focus on more important things!
Book a Demo with Driftrock today to increase your ROI from lead generation today!