.svg)
Measure & Optimise
Discover the origin of leads & sales, optimise campaigns with conversion data and measure performance all in one place.
Trusted by 35+
Automotive Brands
Automotive Brands
.svg)
.svg)


3X
Volkswaggen UK
Increase in lead conversion rates from Meta Lead Ads
210%
Driftrock EV campaigns
Year-on-year EV lead increase through Driftrock's publisher network
↓ 30% CPL
BYD Spain
30% reduction in cost-per-lead through improved targeting and validation
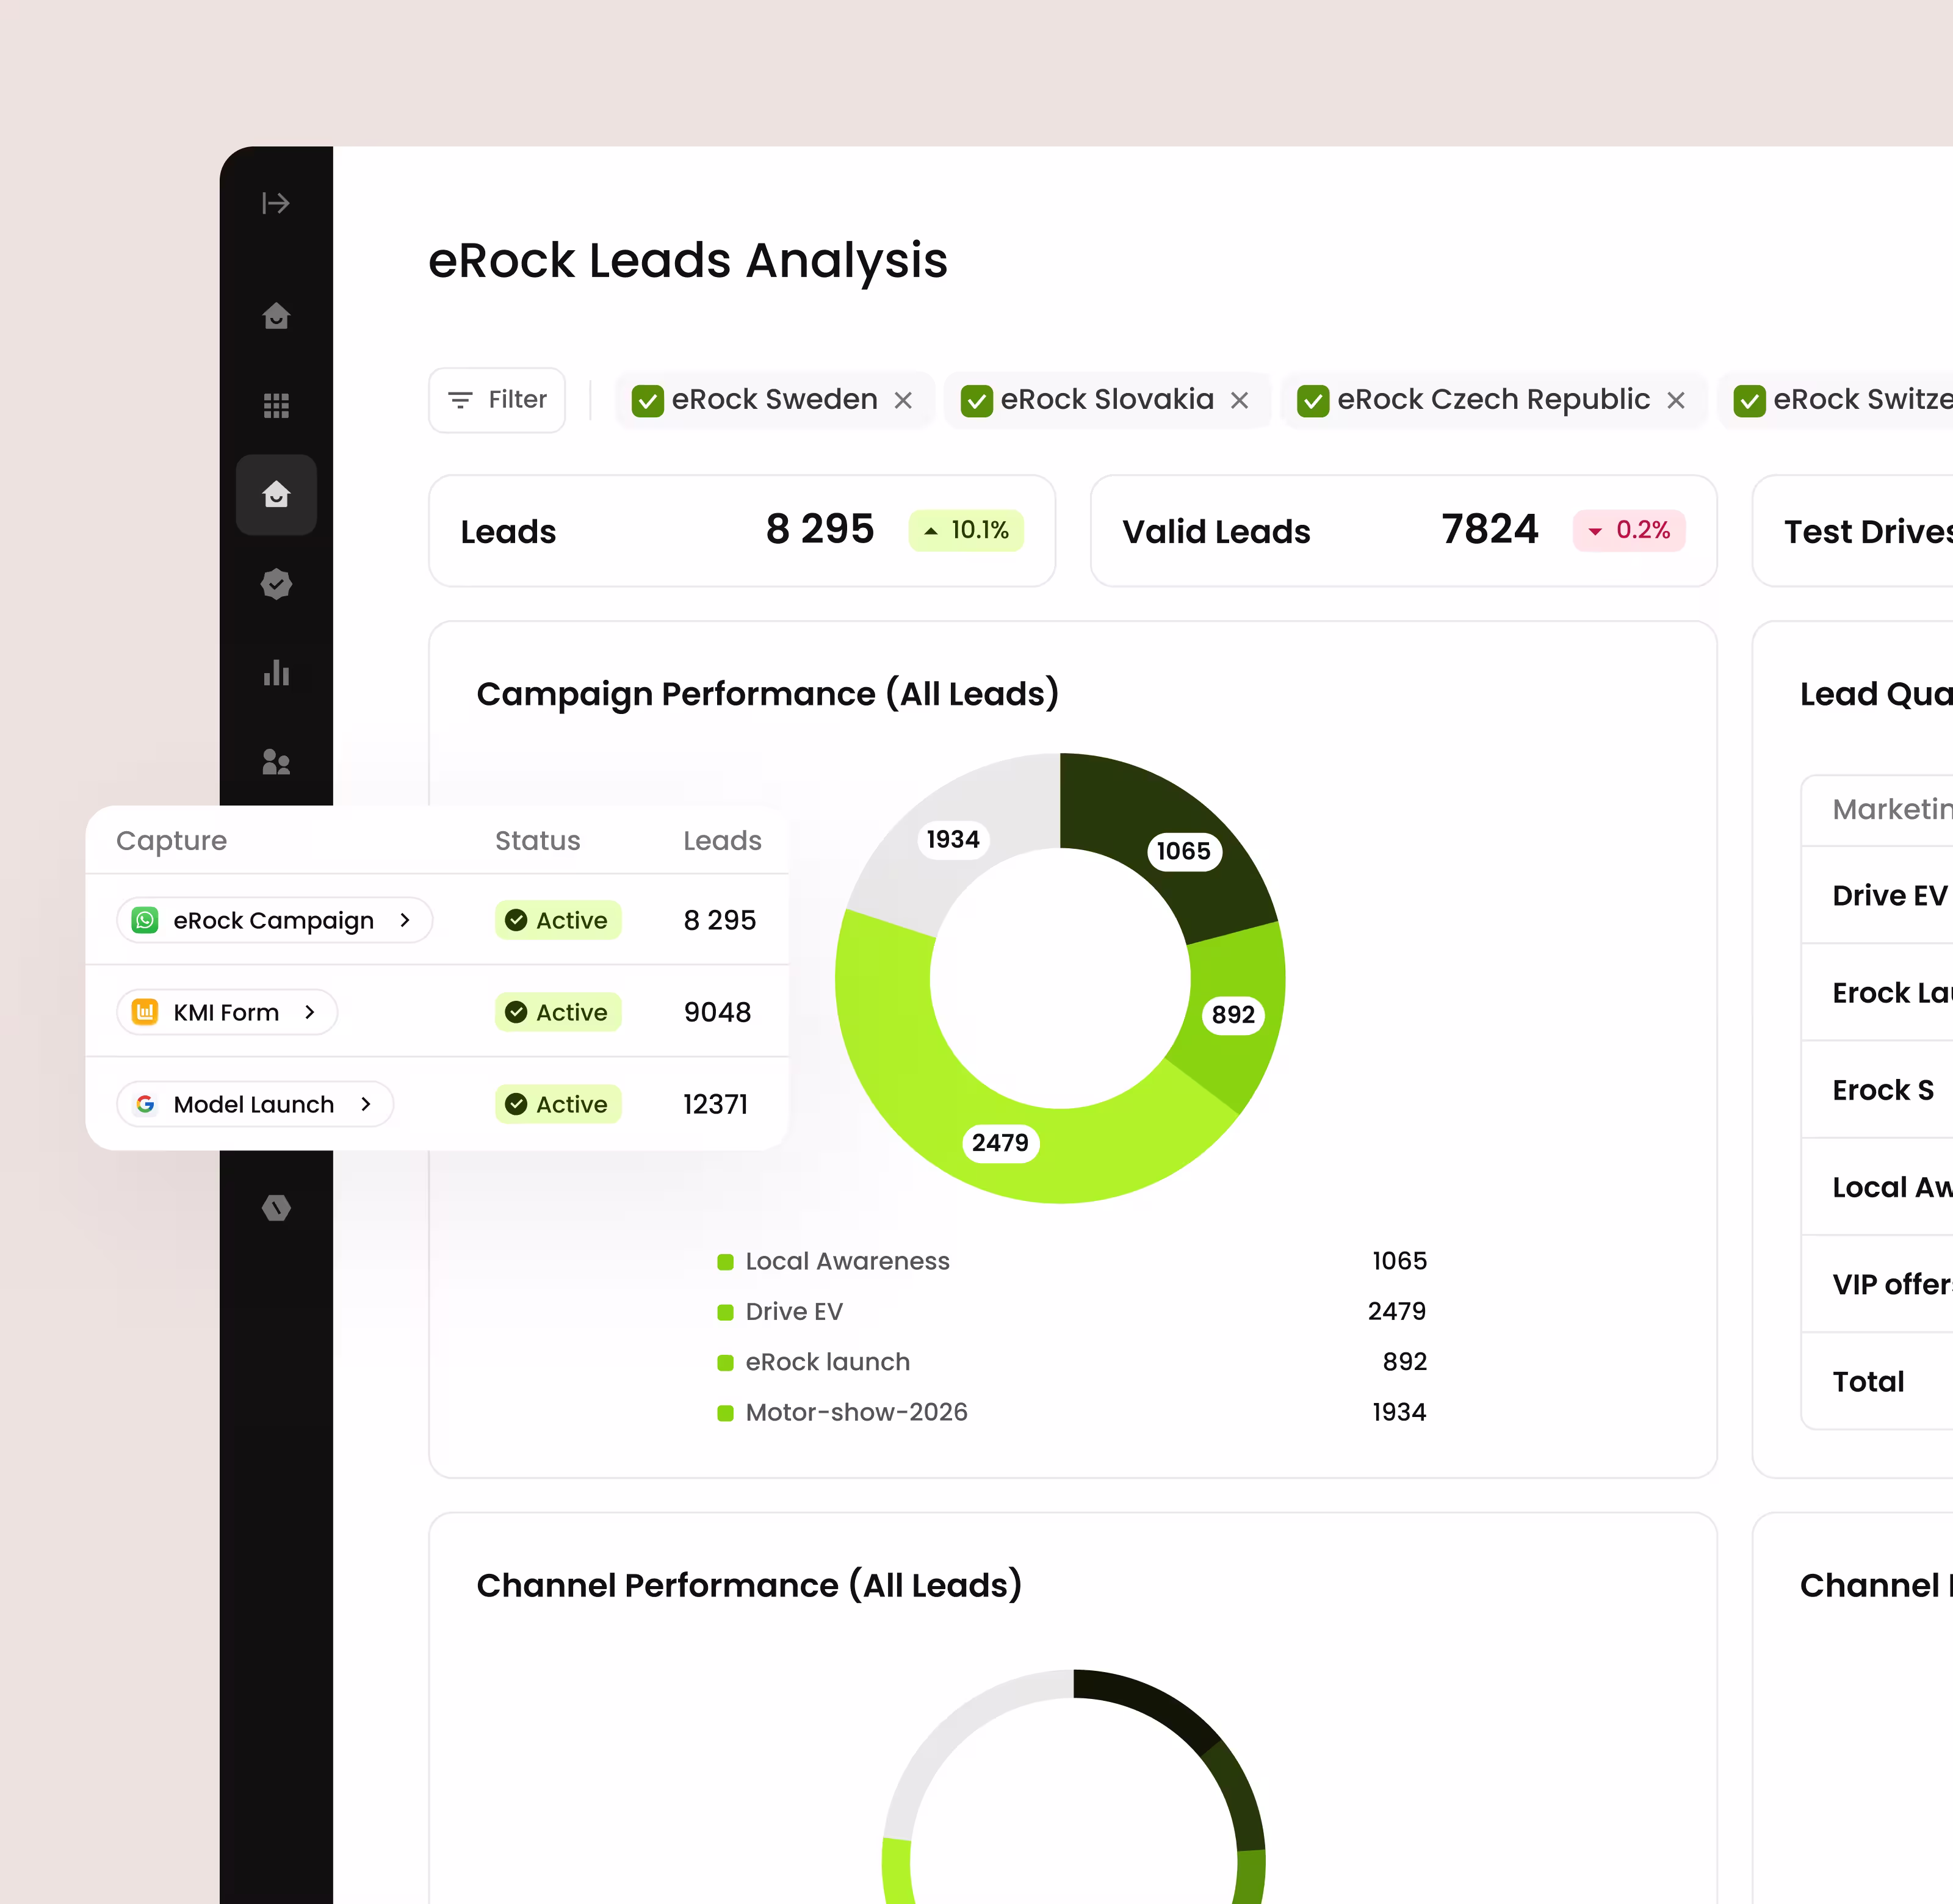
Understand Marketing Impact
Track campaign results, monitor all channels, identify winning tactics, optimise with data insights, and measure ROI—all in one place.
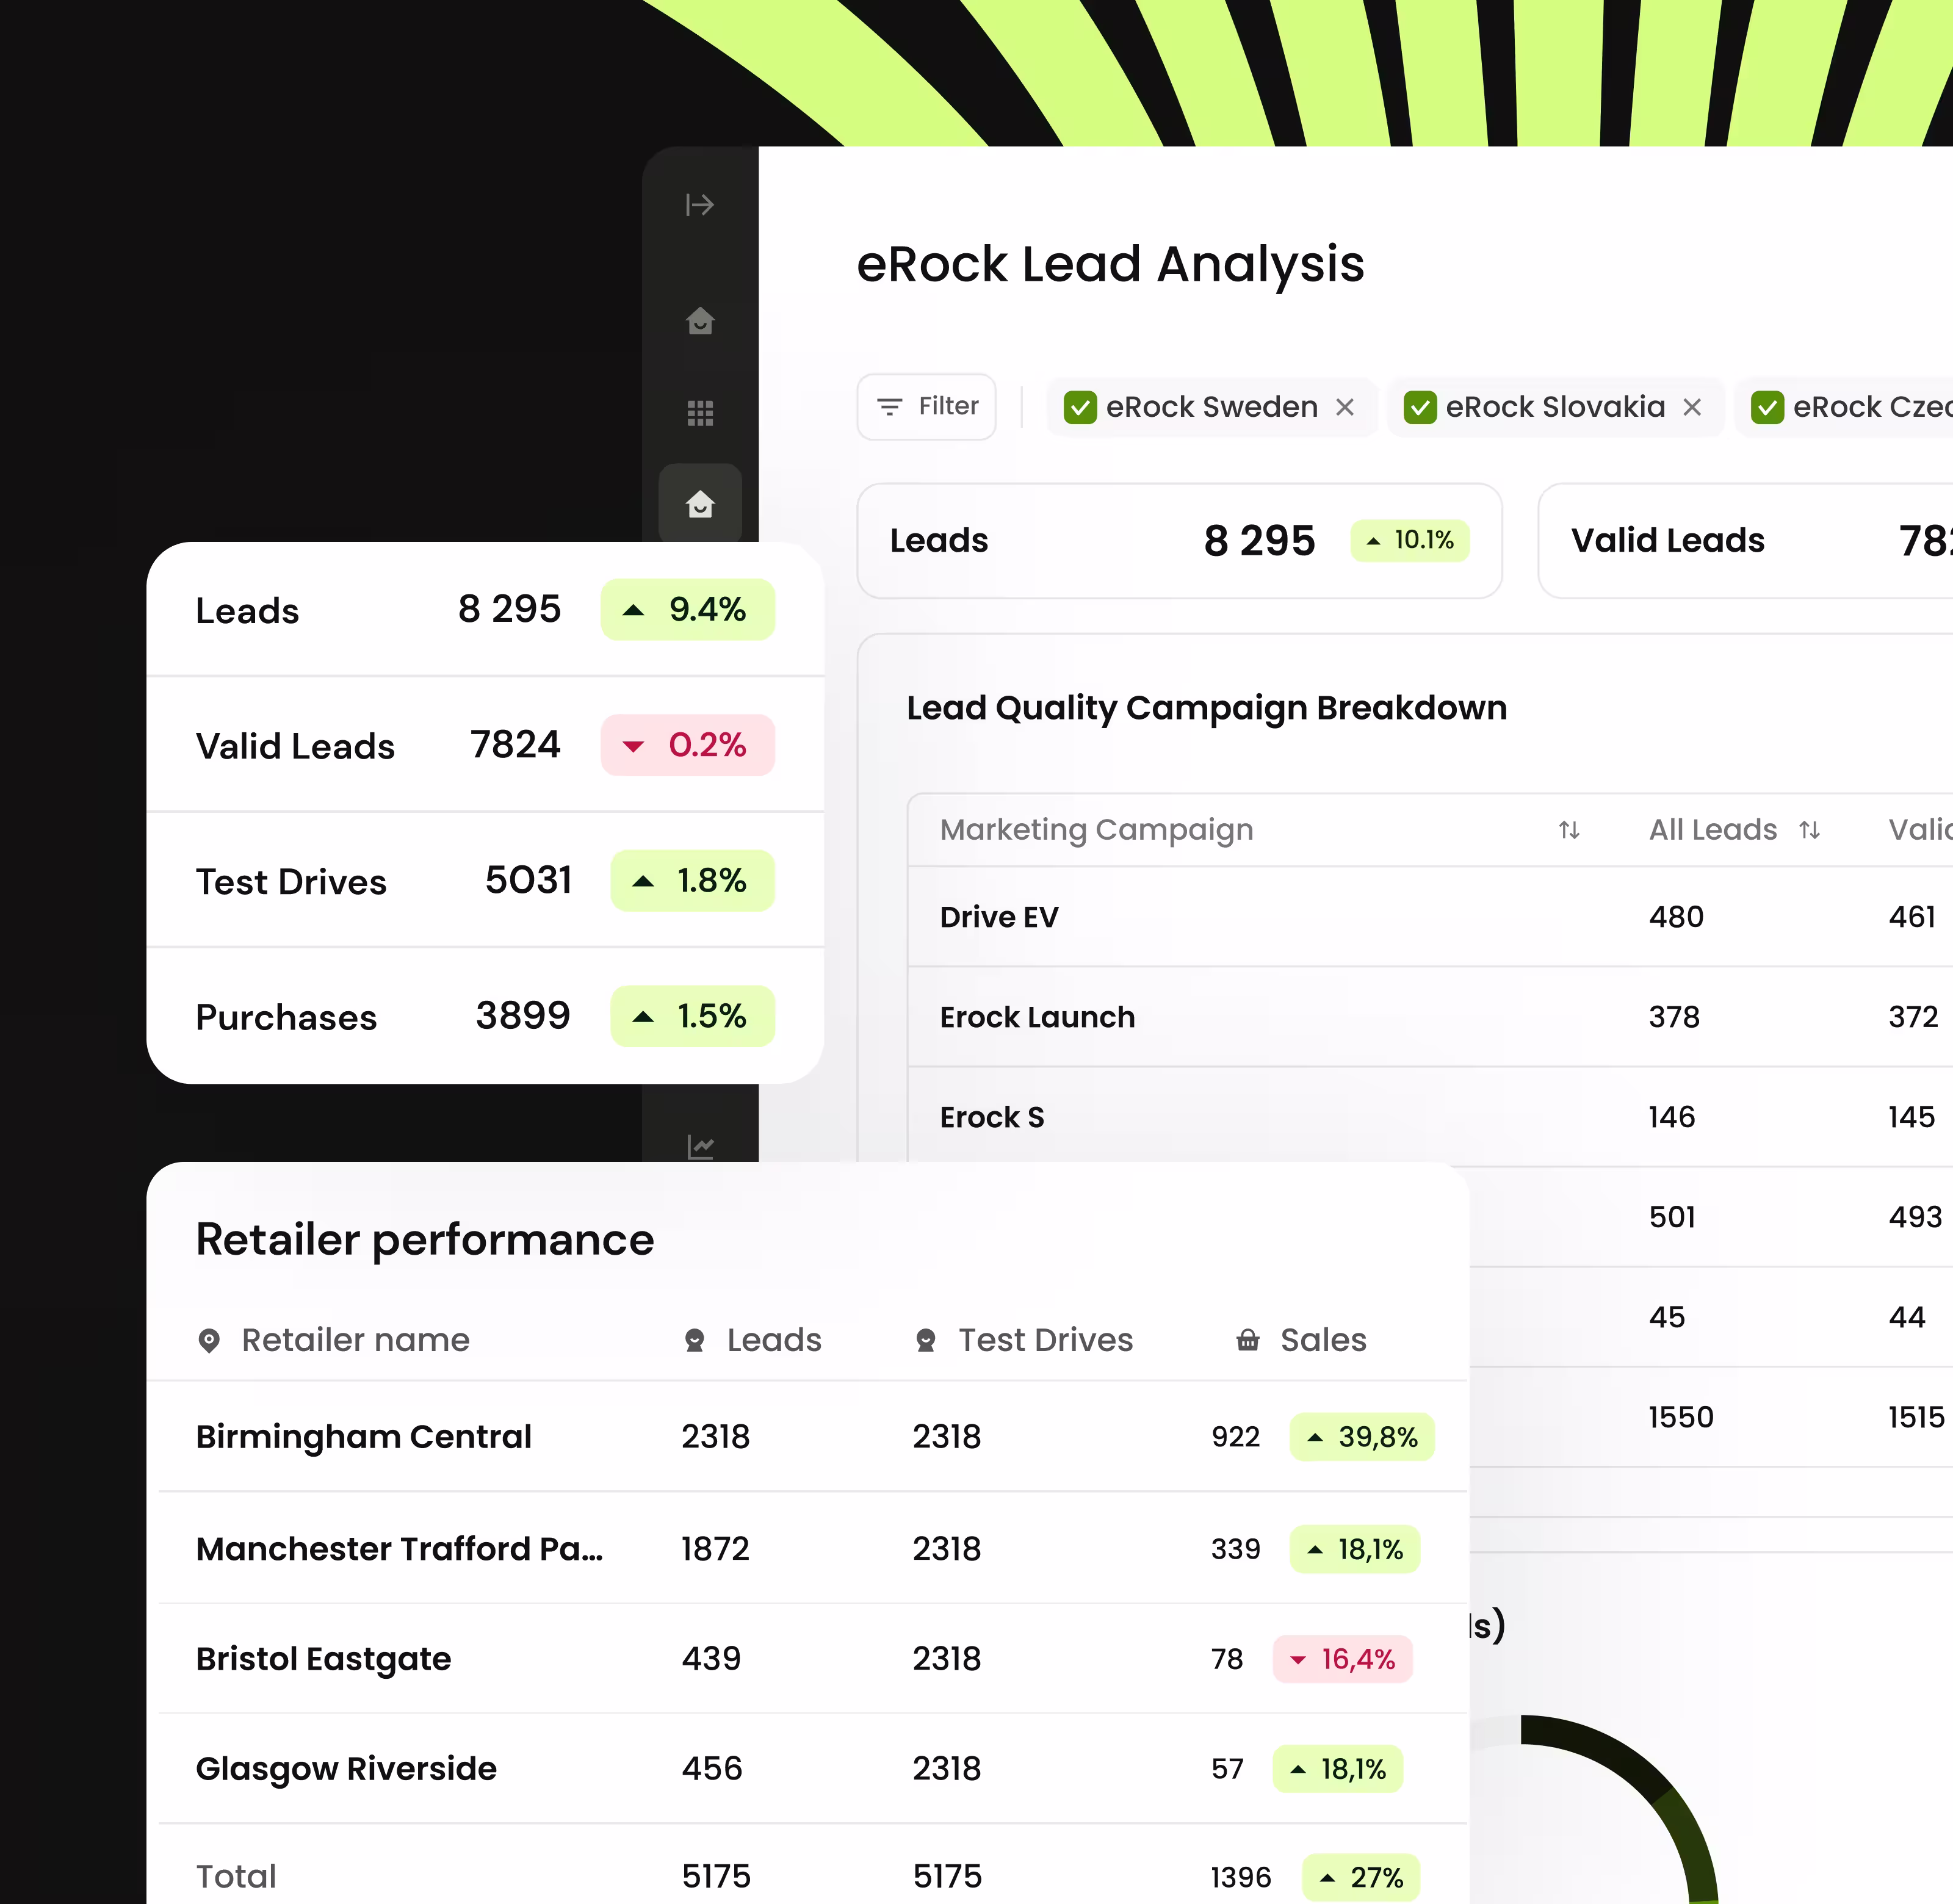
Live reporting dashboard — granular view by ad, keyword, audience, model, dealer
Downstream tracking — lead to test drive to vehicle sale matching
CRM Conversions API — send offline events to Meta, Google, LinkedIn, TikTok, Snapchat
Website Server-Side Conversions API — future-proof against cookie deprecation
Cross-market reporting — single view of performance across all markets
Get Started Quickly with Template Dashboards
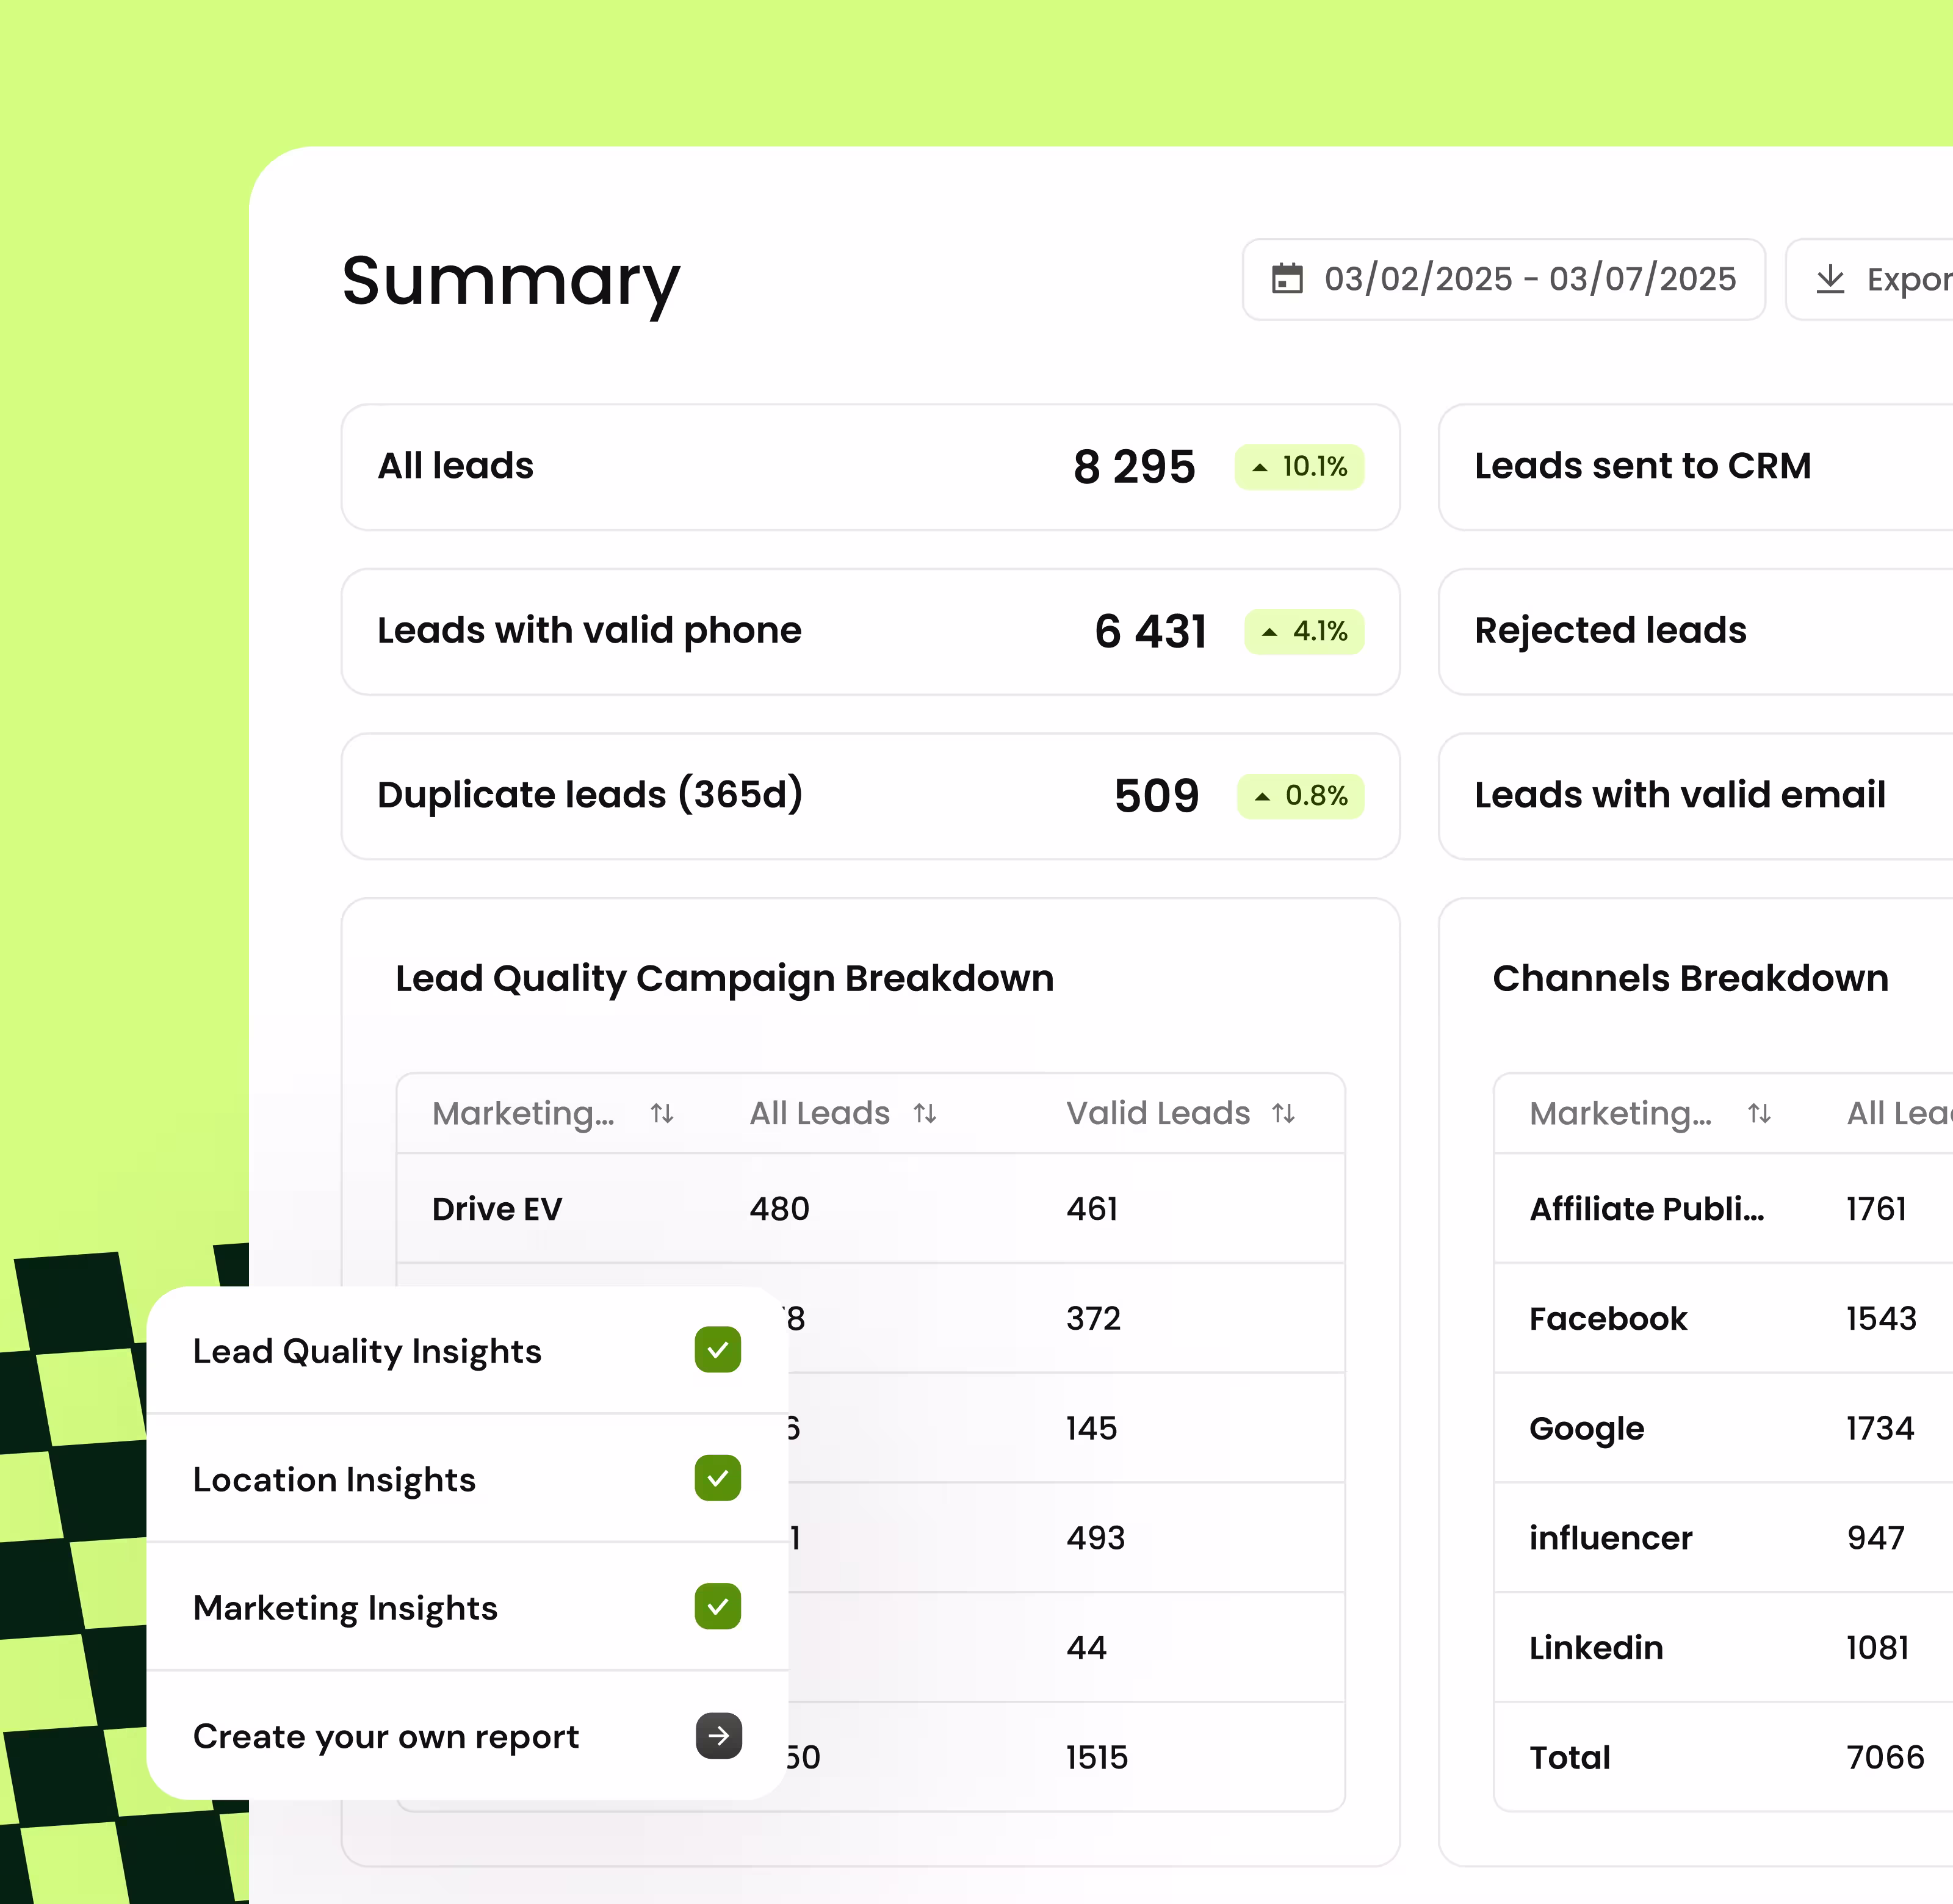
Access insights immediately with ready-to-use templates for marketing, sales, location, channel, funnel, and campaign tracking—no technical expertise required.
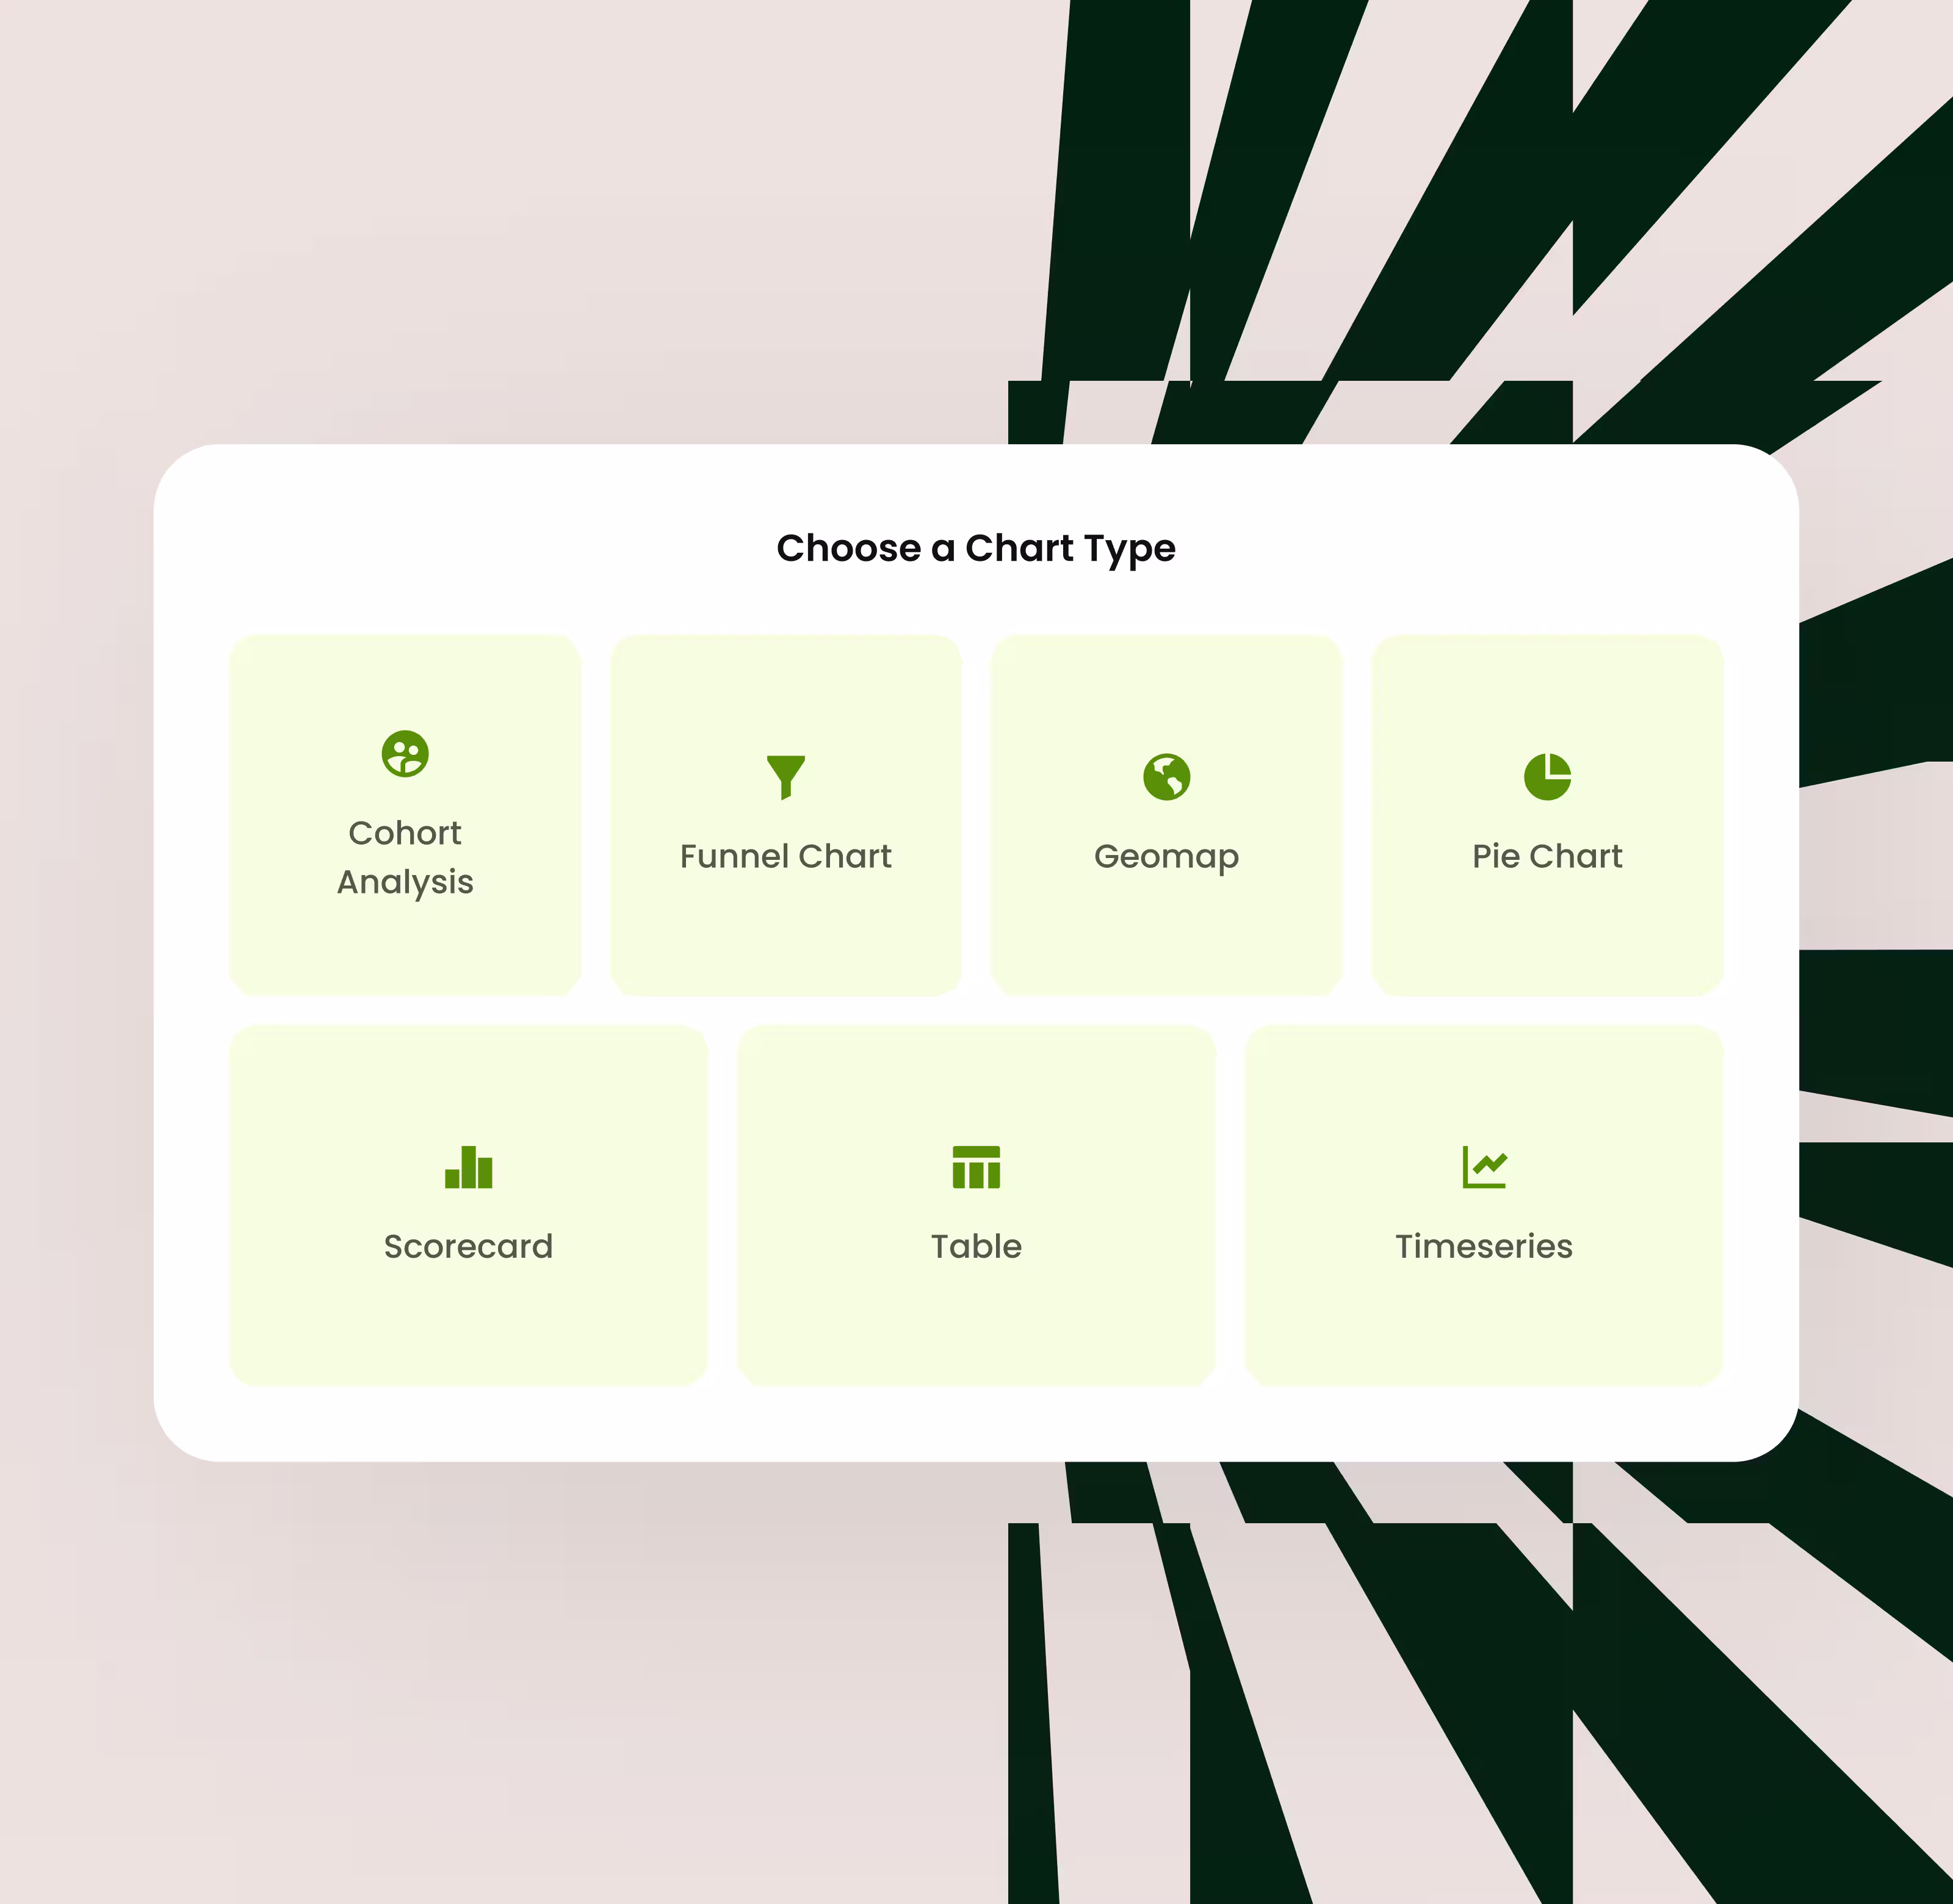
Choose How to View Your Data
Visualise your data with geo-location maps, dynamic tables, interactive line graphs, intuitive bar charts, and colorful pie charts for comprehensive analysis.
Start with our Template Dashboards: Lead Quality Insights, Location Insights, Marketing Insights... Save time creating your perfect dashboard with our templates.
Create your own Dashboards: Monitor your data, the way you want —no technical expertise required. Get tailored advice from our Automotive Experts Team.
Optimise Your Campaigns Automatically
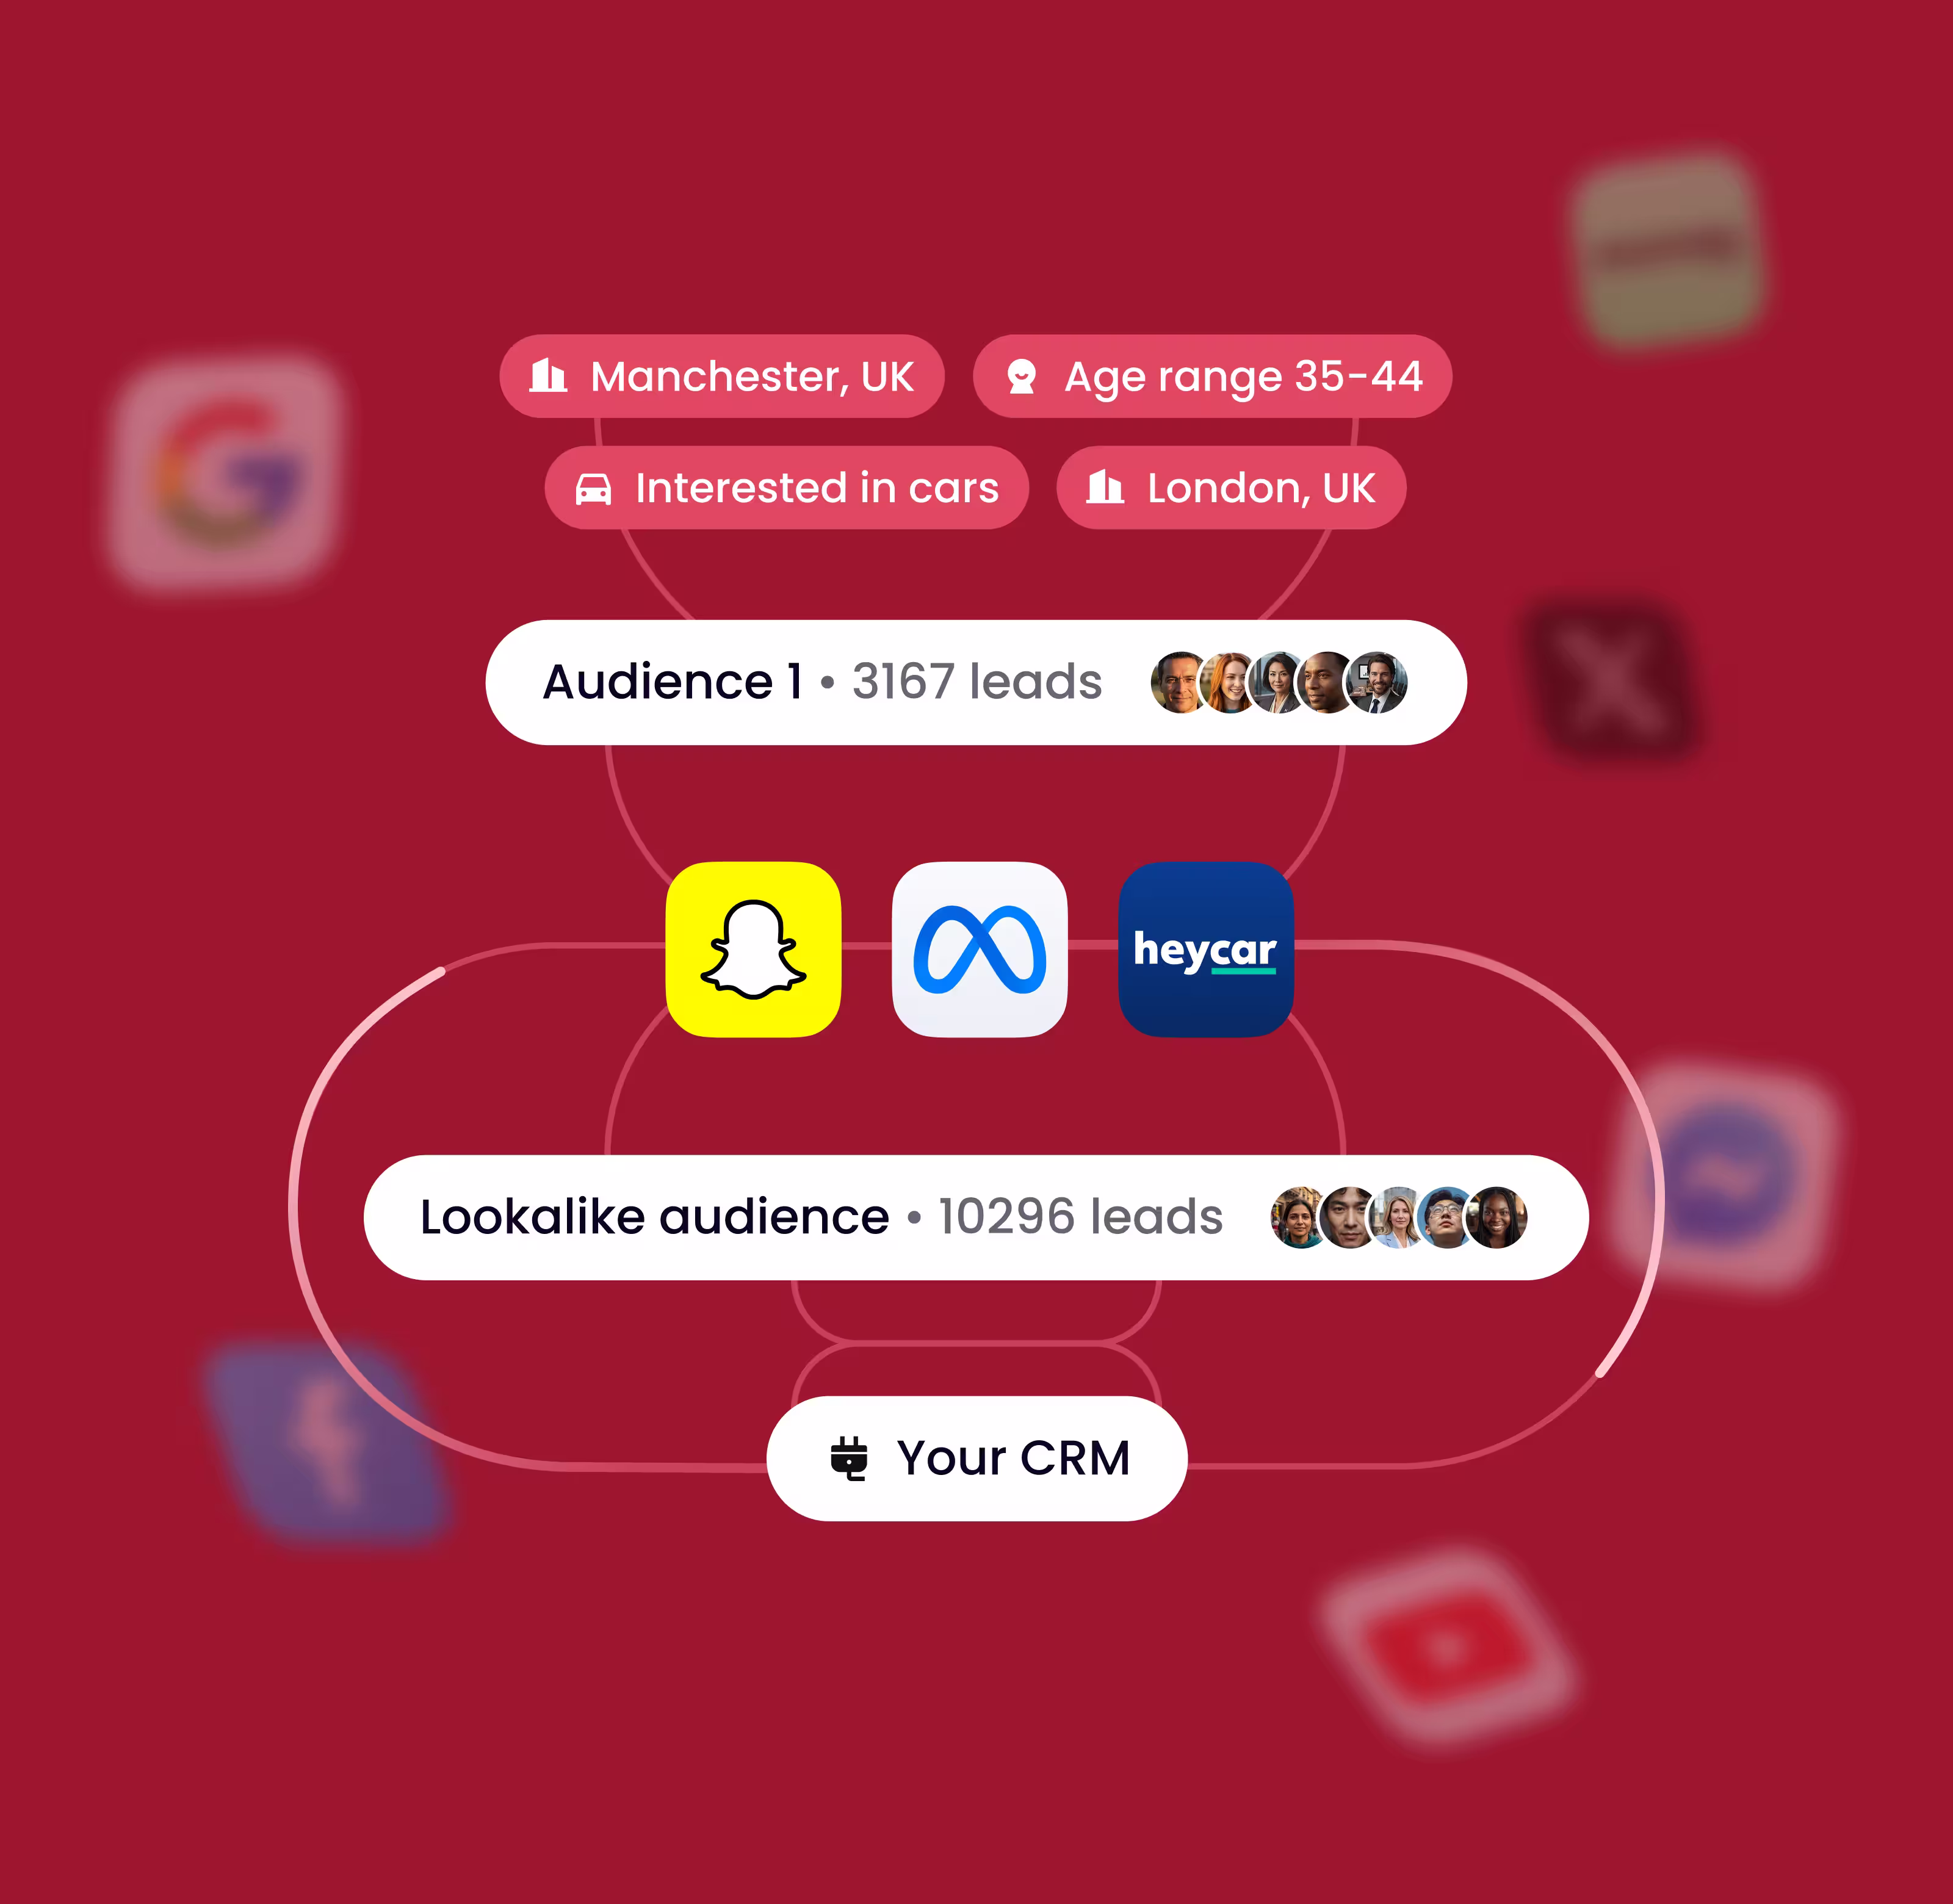
Return purchase and lead conversion data to your advertising platforms to target lookalike audiences and generate more qualified leads.
See How Your Campaigns Drive Sales
Unify your upstream and downstream data to reveal which channels and campaigns truly drive revenue growth. Transform insights into sales performance.
Turning digital intent into vehicle sales
70%
of the automotive industry relies on us
1.3M+
automotive leads a year
$1B+
vehicle sales fueled annually
“Driftrock helped us generate specific dashboards to analyse which dealers perform better, which channels perform better, and how to split our budget more efficiently for the next month"
Miguel Lopez
Paid Media & Data Analysis Specialist @ BYD Spain
Volkswagen Increases Meta Lead Conversion Rate 3x with Driftrock
Discover how Volkswagen increased Meta lead conversion rate 3x with Driftrock
x3 conversion rate
On Meta leads
On Meta leads
"The Meta CAPI offline conversion trial has proven to be a big success, by delivering a substantially lower cost per lead and more leads from the same social budget. Due to the success of the activity, it will be integrated into our overall lead generation strategy on social for 2024, ensuring we deliver more, better quality leads for the business."
Katie Blesovsky
Volkswagen UK, Performance Marketing Manager

Discover our customer stories
See all stories
.svg)

.svg)

.svg)


.svg)


.avif)
Features to Measure & Optimise
Marketing Metrics
Track campaign effectiveness with comprehensive marketing performance indicators.
Conversion APIs
Optimise campaigns automatically with Conversion API integrations.
Sales Metrics
Monitor downstream car purchases with detailed sales performance analytics.
Templates
Plug and play with ready-to-use templates designed for immediate results.
Data Visualisations
Customise how you interpret insights with multiple visualisation formats.
Privacy & Security
Industry-leading protocols to ensure maximum data protection and compliance.
One system. The full automotive lead lifecycle.
Discover Driftrock’s solutions for every stage of the automotive lead lifecycle.
.avif)
Increase lead volume
Target new audiences, boost conversion rates and optimise campaigns to drive more leads.

Increase lead quality
Reach high quality audiences, reduce lead slippage and increase conversions.
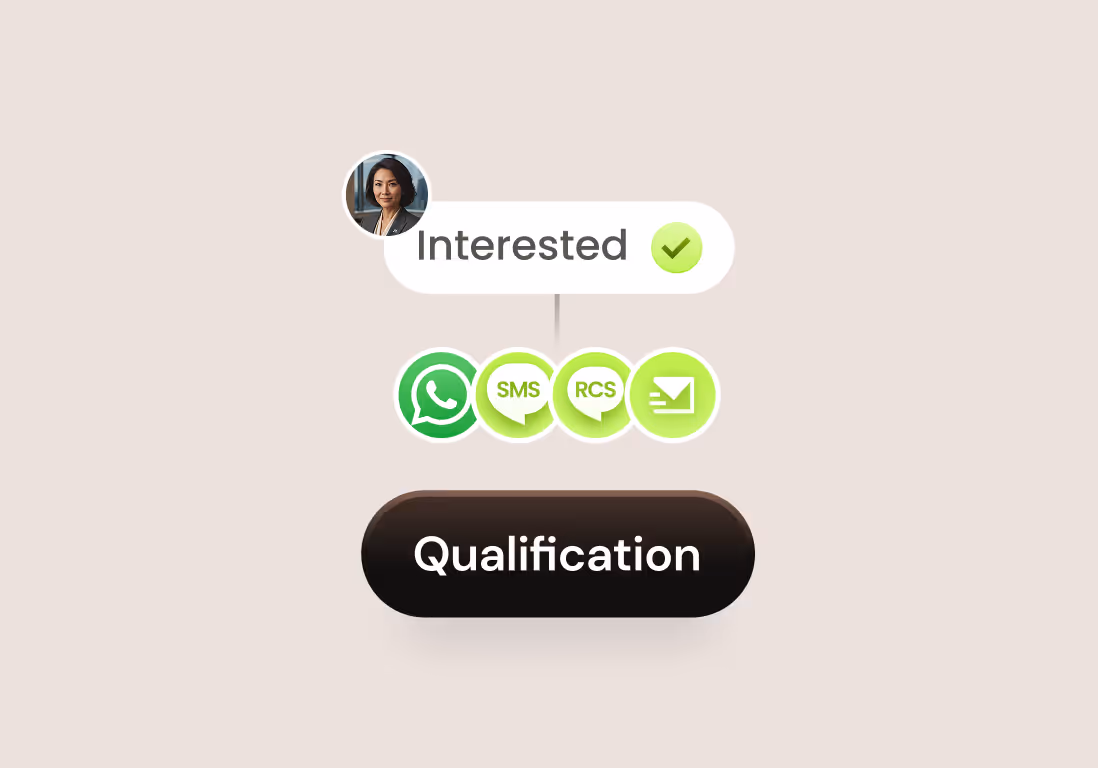
Increase conversions
Driftrock Convert automatically qualifies and converts enquiries via WhatsApp, email and SMS/RCS.

Drive EV Lead Volume
Reach high intent EV audiences, optimise campaigns and boost conversion rates to drive more EV sales.