.svg)
As automotive companies increasingly embrace technology, data is becoming the new currency. At the same time, customer behaviour is rapidly evolving, and unique preferences keep coming in.
However, the growing mountains of data within business systems are unorganised.
Digging into this data, tracking actionable insights, and implementing them confidently needs a reliable automotive marketing reporting dashboard.
What is an automotive marketing dashboard?

A marketing KPI dashboard uses quantifiable measures (or key performance indicators and metrics) to assess automotive companies' marketing performance.
It unites performance data from multiple sources and displays insights visually—as interactive graphs, charts, tables and statistical numbers—for organised analysis and decision-making.
Typically, it's a visual guide to your success and growth by keeping track of critical marketing and lead generation KPIs or metrics.
It also graphically summarises the outcomes of the specific business objectives you choose to represent.
Automotive marketing dashboards don't just share insights. They share 'actionable' insights that you can implement quickly and confidently.
These real-time insights could be used to measure, monitor and improve your performance.
Not tracking key performance indicators performance is like flying blind
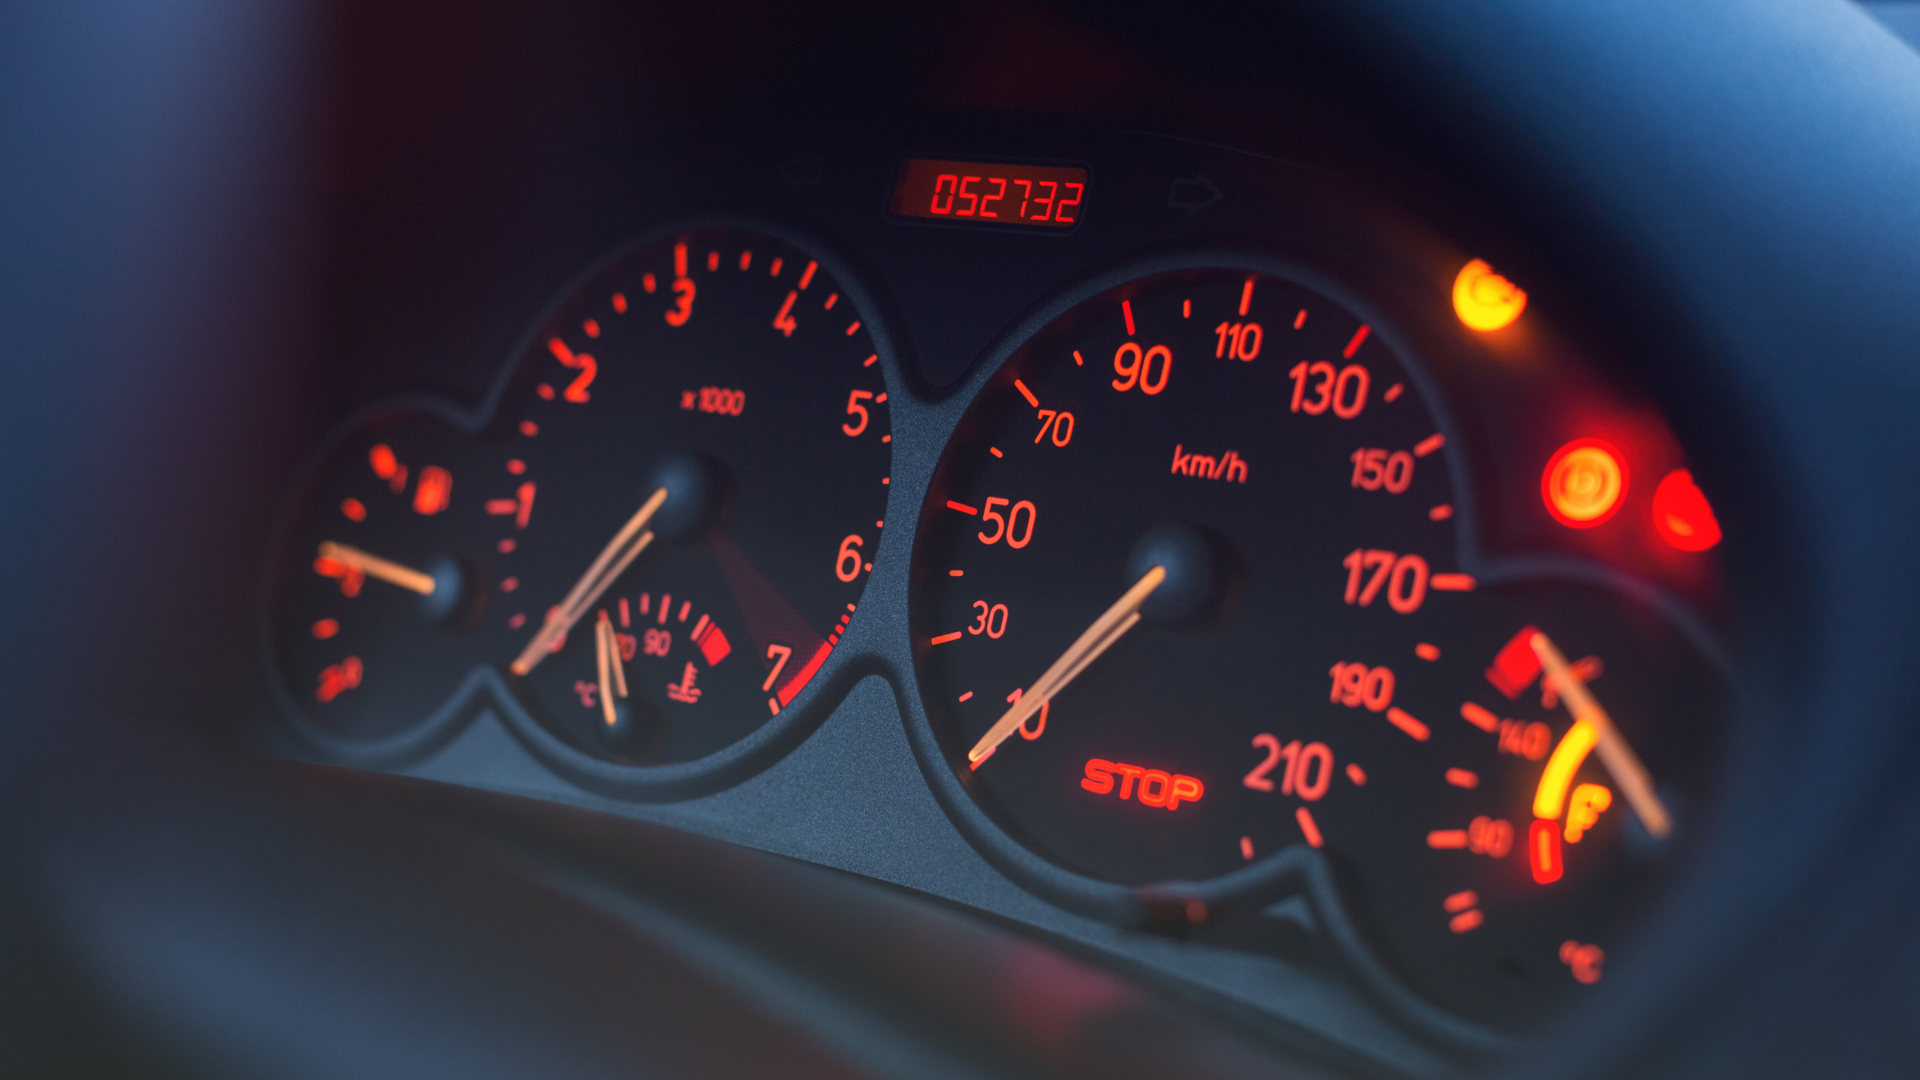
Picture this. You're going out for a drive. Sitting in the car, what's the first thing you do after turning the key into the ignition?
You check the dashboard for indicators of the health of your car. Now, what would it look like driving without a functioning dashboard?
Unimaginable? Maybe. Hazardous? Definitely.
The same goes for the marketing dashboards of automotive companies.
They act as a health indicator and guide, highlighting whether your campaigns are delivering.
They also provide critical data on best-performing areas. And bring improvement areas into focus so you can make time adjustments to avoid a decline in revenue.
You can also spot problem areas and dive deeper into the underlying causes.
For example, YouTube as a channel may bring in more engagement and leads from your target audience (using insights from top of the funnel). However, comparatively, LinkedIn may have lower engagement or higher CPL. Yet, it brings in leads with powerful purchase intent and subsequently, has higher ROI.
A reporting dashboard can give you this insight by analysing granular data from multiple platforms.
Similarly, it also tracks and analyses trends (internal and external) for you to capitalise on before other automotive companies do. Plus, it compares and understands growth during a given time period.
Executives use marketing performance dashboards to make data-driven decisions with confidence.
And it's not just executives. These dashboards cater to a diverse set of managers and reps, too. You don't need to have statistical knowledge to use them.
Interactive visualisation makes data easy to understand, creating a new avenue for business performance analysis.
If you're an automotive manufacturer, you can determine which dealerships need an encouraging push and which ones need an appreciation of their efforts.
Over time, being focused on data lets you drive a data-first culture in your automotive company at the OEM, dealership and service levels.
To steer growth, track these metrics on your automotive marketing dashboard
There are a few marketing and lead generation KPIs for the automotive industry that you simply cannot miss. We've listed them below:
1. MQLs & SQLs
Marketing Qualified Leads (MQLs) are those leads who are interested in your product but haven't explicitly expressed a desire to purchase yet.
An example could be Keep Me Informed (KMI) leads. They are interested in your offerings but haven't decided yet.
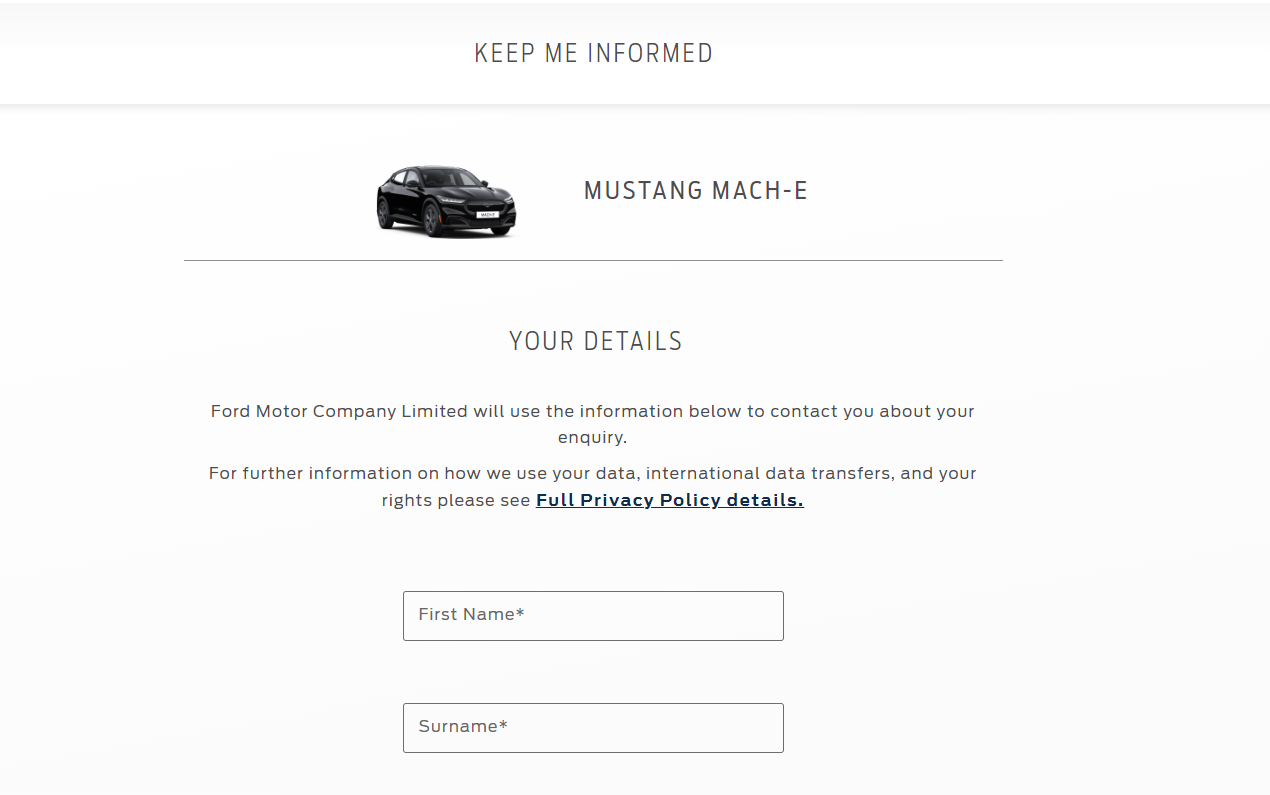
Source: Ford Motors
You can nurture them towards purchase by keeping them informed about:
- Upcoming launches
- Product updates
- Explainer resources
- Exclusive discounts
- Marketing offers
Sales Qualified Leads (SQLs) are those who intend to purchase from you and have expressed their intent. A lead filling up your form to test drive your offerings is an excellent example of an SQL.
The key difference between MQLs and SQLs is intent.
MQLs need further nurturing to convert into SQLs. And don't have direct or explicit purchase intent.
On the other hand, SQLs are empowered with resources, in-depth research and higher purchase intent.
To differentiate between MQLs and SQLs, you can use lead-scoring methods and automate the process.
2. Lead quality
A quality lead fits your ideal customer profile (ICP) the best and is interested in your product. Therefore, higher lead quality equals a higher probability of conversion.
Generally, lead scoring methods can identify lead quality. However, these may need manual intervention and are time-consuming.
Automotive marketing dashboards can automate this.
A lead management system can support lead quality by validating leads before they reach the CRM. Driftrock does this by validating emails, phone numbers and addresses, ensuring you only reach out to real prospects.
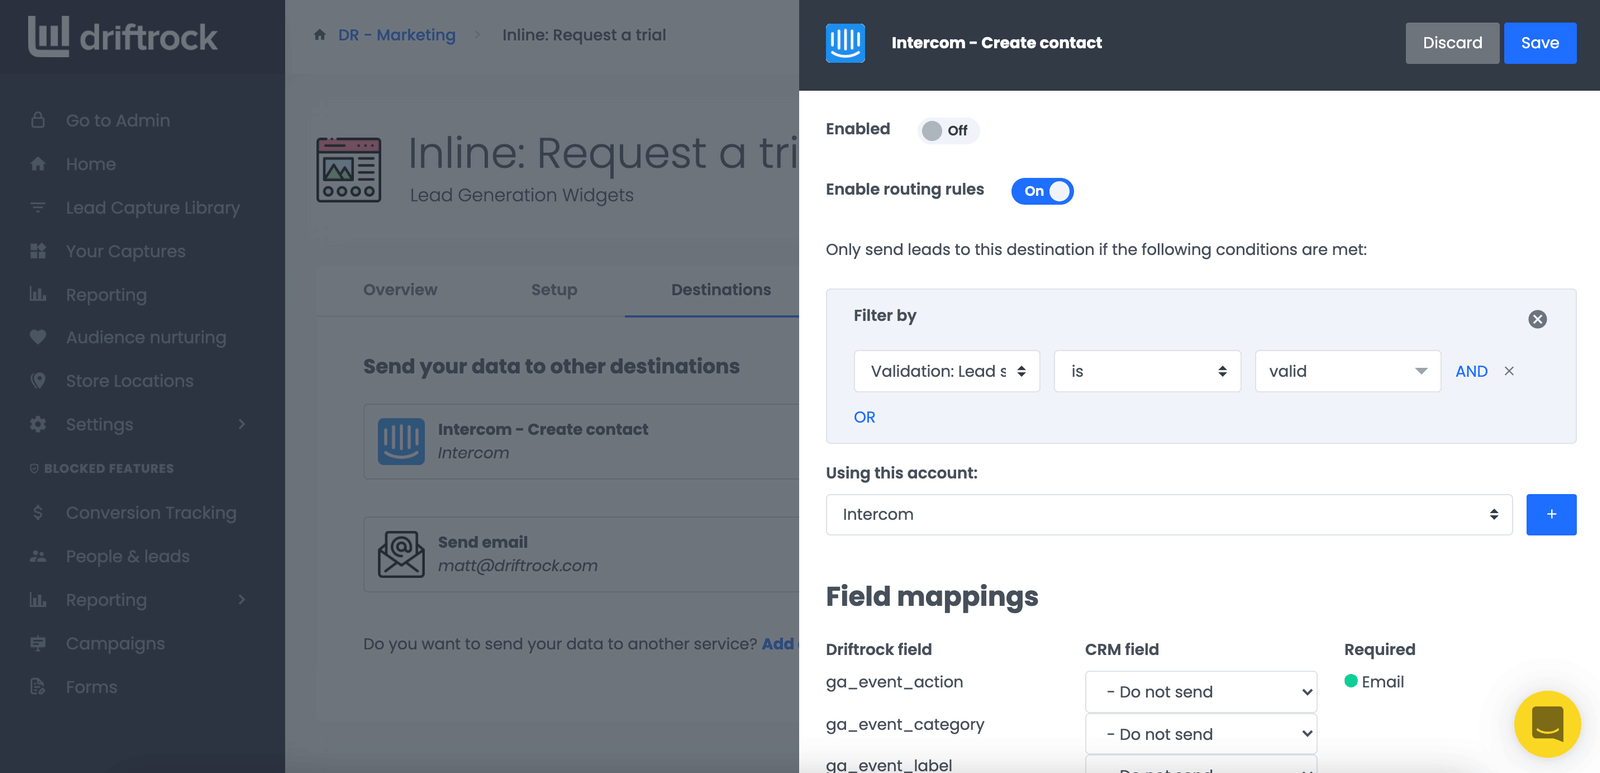
Plus, it can track leads from multiple sources and automotive affiliate publishers worldwide. It also optimises channels, ads and keywords, which are most responsible for bringing in poor-quality leads.
Good lead quality ultimately has an overarching impact by reducing customer acquisition costs and improving ROI.
3. Cost per lead (CPL)
CPL is the average amount you spend to acquire a new lead. It's calculated as below:
CPL = Total campaign cost ➗ Number of leads generated
For example, if your total campaign cost is £5,000 and you generate 1,000 leads from this activity, your CPL is £5.
The lower your CPL, the more efficient your marketing or sales campaign. But that's not all. As mentioned above, lead quality also matters as higher quality leads may cost more but attract better ROI.
You can find out how well you performed by noting industry benchmarks.
The average CPL for Automotive (For Sale) is $42.52, while the average CPL for Automotive (Repair, Service and Parts) is $21.12.
4. Customer acquisition cost (CAC)
While CPL considers leads, CAC looks at leads who converted to paying customers.
CAC is the cost of acquiring a new customer over a specific time period. It shows how much you need to spend to acquire a new customer.
The formula for CAC is:
CAC = Total marketing and sales cost ➗ New customers acquired
Marketing and sales costs include digital marketing, offline ad spend, salaries, commissions, and more.
The above expenses are generally associated with converting leads to customers. Because of this reason, CAC can be helpful to optimise your marketing budget.
5. Time spent on website
'Time spent on website' indicates the total time a visitor spends navigating your website.
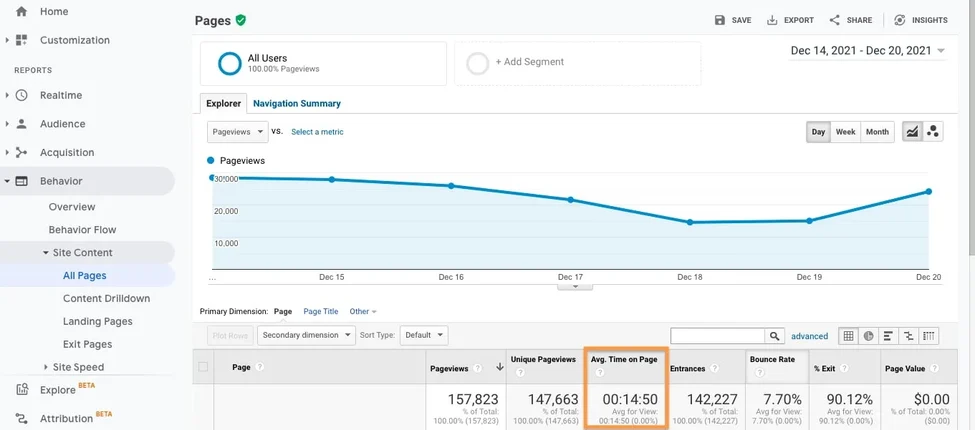
Source: HubSpot
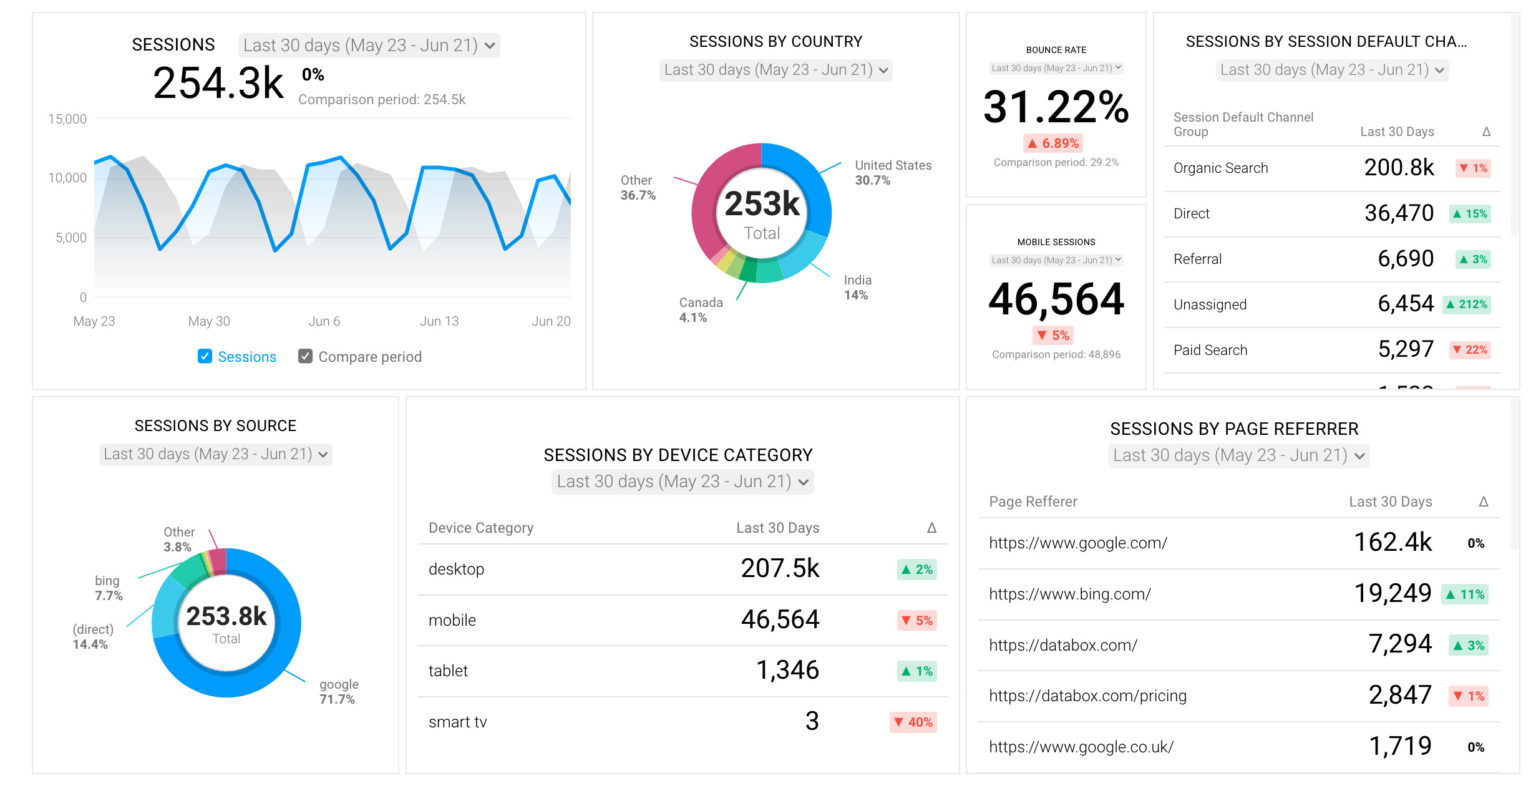
Source: Databox
It's calculated from the timestamp when a visitor clicks your website link on the SERP or landing page and ends when the visitor exits or bounces.
But why is it a key metric?
59% of buyers research their preferred cars online for several months before entering a dealership. Plus, they use multiple websites for this research. These websites include automotive manufacturers, dealerships, and used vehicle retailers.
Therefore, 'time spent on website' becomes a crucial metric.
The longer visitors stay on your website, the more interested they are in your vehicles. It denotes a higher purchase intent, and these visitors will likely increase your engagement.
6. Time spent on the Vehicle Detail page
This KPI denotes the total time a visitor spends specifically on your 'vehicle details' page until they exit or bounce.
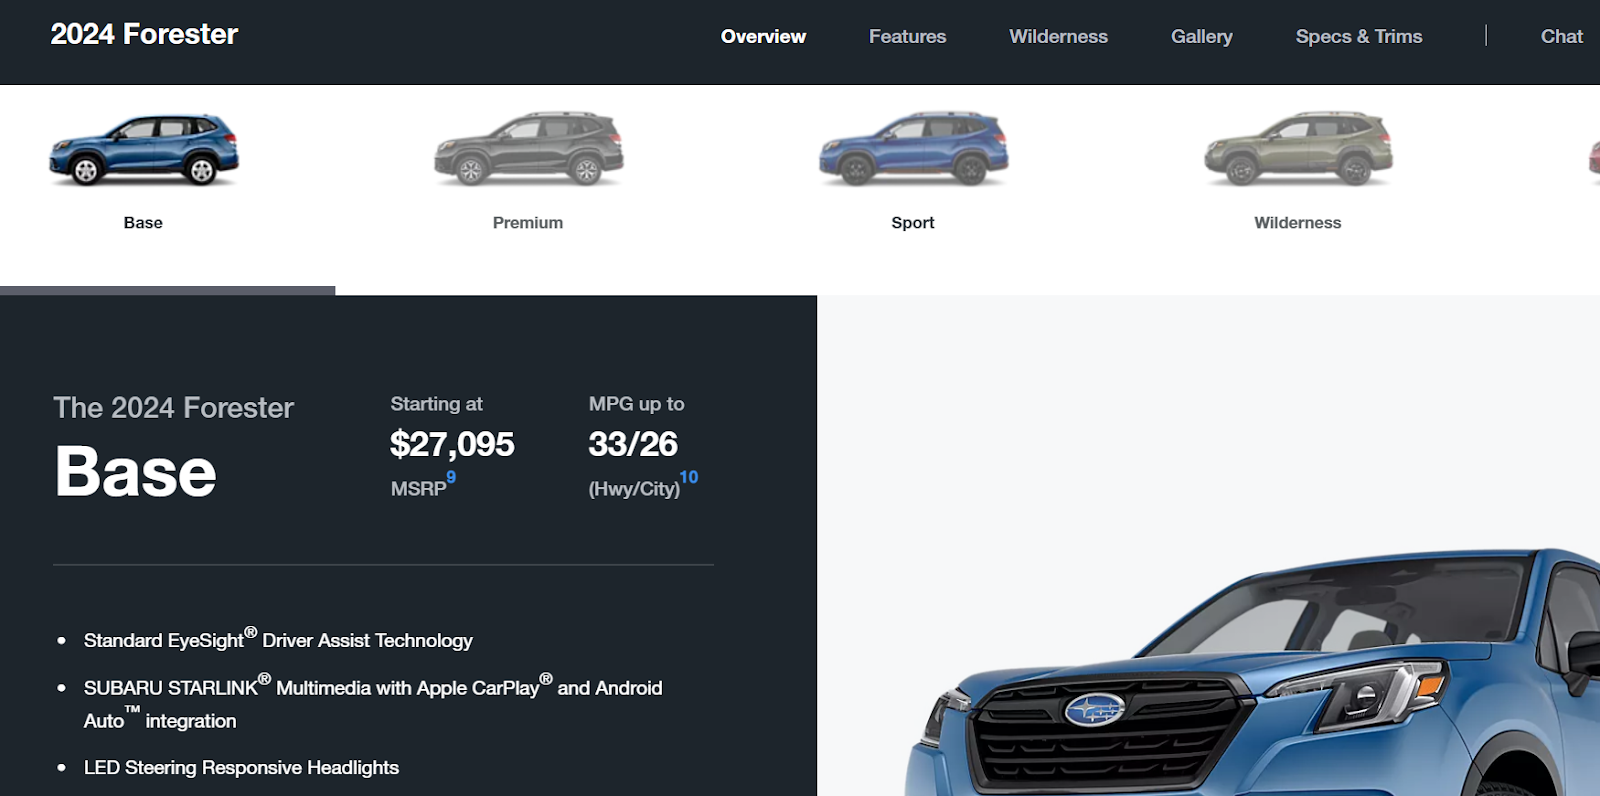
Source: Subaru
Similar to the previous metric, if the 'time spent on vehicle detail' page is high, the visitor may be considering a purchase (i.e., they may become a buyer with high purchase intent).
Higher time spent indicates that your marketing campaign is working and getting leads interested.
You can use this information to remarket to interested buyers and nurture them to purchase.
7. Bounce rate
Bounce rate is the percentage of visitors who visit a single web page on your website and leave without taking any action. This action could be a click, download, form-fill or more.
This KPI determines if your page is engaging enough or not.
High bounce rates indicate that your page isn't appealing enough. It may need refinement in the page layout, user experience or content to convert more visitors.
8. Click through rate (CTR)
Click-through rate is the total number of clicks you receive based on the number of times your ad is shown to audiences.
The formula is:
CTR = (Total number of clicks ➗ Total number of impressions) ✖ 100
CTR is a crucial indicator of your search ad quality, keyword performance and campaign efficacy.
A high CTR means users find your listings or ads helpful and resourceful. It further improves their engagement with your automotive company.
Compare your CTR to the industry benchmarks to find out how you performed. The average CTR for Automotive (For Sale) is 8.77%, and for Automotive (Repair, Service and Parts), it's 5.91%.
Leverage this metric to understand the campaigns' cost efficiency better and improve the ad rank.
9. Cost per click (CPC)
While CTR calculates the click rate, CPC calculates how much you spend, on average, every time a visitor clicks on your ad.
It’s calculated as below:
CPC = Total number of clicks ➗ Total campaign cost
The lower your CPR, the more effective your campaigns are. The industry benchmark for average CPC is $2.08 for Automotive (For Sale) and $3.06 for Automotive (Repair, Service and Parts).
Use the CPC metric to understand marketing efficacy by comparing ads, campaign types and keywords.
10. Social media engagement
This KPI measures audience engagement actions on your social media account and posts. It includes likes, comments, reactions, shares, reposts, views, saves, clicks and mentions.
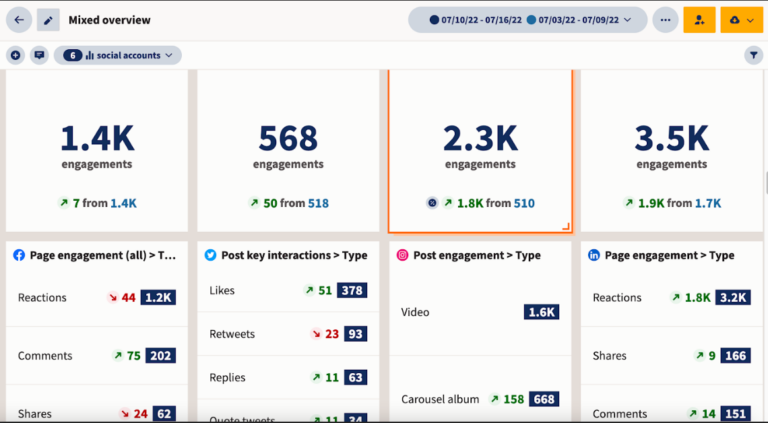
Source: Hootsuite
A positive sentiment for social media engagement shows that the audience resonates with your content. Negative and neutral sentiments indicate that you must develop better-quality content.
You can also use this metric to assess your relationship-building progress with specific automotive communities. It shows where you need to improve engagement by responding to comments, addressing queries faster and sharing user-generated content (UGC).
Better quality engagement increases your chances of converting visitors to leads and leads to customers.
11. Return on investment (ROI)
ROI measures the profit or loss of your marketing and lead generation activities. It shows how successful (or not) your campaigns have been.
Multiple methods for calculating ROI include Simple Cost Ratio and Revenue Attribution. You can read our detailed guide on understanding and calculating ROI to learn more.
ROI may differ for each campaign, depending on your chosen objectives. You can use this to determine which campaigns perform well, optimise campaigns, replicate winning patterns and improve your bottom line.
12. Conversion Rate
Conversion rate is the percentage of intended user actions on your marketing asset. It could be your website, display ads, social media posts, or something else.
The formula for conversion rate is:
Conversion Rate = (Total number of conversions ➗ Total number of clicks) ✖ 100
The average conversion rate for automotive companies is 2%. However, top performers may also see conversion rates of up to 16%.
Naturally, the higher your conversion rate, the more effective your campaign is. You can use this KPI with ROI to determine marketing's impact on the bottom line.
13. Inbound response time
Inbound response time signifies the average time you take to respond to an inbound lead. It may also show how many inbound leads you've managed to convert.
It's more lucrative to strike when the lead is hot. Therefore, quicker response times improve conversion.
Today's customers expect instant gratification. You could lose a customer if your competitor contacts them before you.
Inbound response time is an indicator of after-sales service, too. Customers may be influenced to think that your speed to respond translates into high-quality service even after purchase.
You can easily track this metric via a lead management system. It integrates with multiple marketing platforms, giving end-to-end visibility on each lead's buyer journey.
14. Retention rate & churn rate
Retention or churn rate shows how loyal your customers are and how many of them stick to your product for a specific time period.
They’re calculated as below:
Retention Rate = (Number of active customers ➗ Total number of customers) ✖ 100
Churn Rate = (Number of lost customers ➗ Total number of customers) ✖ 100
For automotives, retention or churn can relate to after-sales activities such as customers purchasing accessories and renewing service or insurance contracts.
A high retention or low churn rate means loyal customers keep coming back to you for more. It could be in the form of purchasing accessories and parts or regular service appointments.
Retention and churn rates show the effectiveness of marketing, better business decisions and customer service.
They're crucial metrics today because of automotive's highly unpredictable industry. Today, high retention or low churn signifies resilience and stable growth.
15. Customer lifetime value (CLV)
CLV (also sometimes called LTV) denotes the total profit customers generate during their relationship with automotive companies.
It can be both predictive or historical. Predictive CLV helps see future profitability, whereas historical CLV shows your performance.
Like retention or churn, CLV covers purchase and post-purchase transactions for service, maintenance, accessories and insurance.
A simple way of calculating CLV for a given time period is:
CLV = Customer value ✖ Average customer lifespan
Here, customer value is the average purchase value multiplied by the average number of purchases.
CLV helps you decide how much you should spend on acquiring and retaining new customers. It can also be used to build strategies for refining customer personas, reducing CAC and boosting retention.
CLV encourages you to personalise the customer journey to improve conversion.
Since it's a less straightforward KPI to understand, you can refer to this guide by HubSpot to dive deeper.
Leverage your automotive marketing dashboard for business growth?
Setting up an automotive marketing dashboard is only half the job done. To grow your business, you must also leverage it in the best possible way. We've listed four such ways below:
- Identify the right metrics
- Set up easy-to-navigate, automated processes
- Optimise lead generation
- Incorporate insights into marketing
1. Identify the right metrics
This may be easily understood, but we must emphasise the first step for setting up your dashboard.
Choose KPIs that are aligned with your business strategy. They need to be strategic and clear.
You may appoint a core team to define relevant metrics for your business. This core team can also do the job of tracking the metrics.
At the same time, it's important to remember that you shouldn't complicate reporting. Don't track too many KPIs. A mix of five to ten metrics is good enough to begin with.
2. Set up easy-to-navigate, automated processes
Measuring your KPIs and calculating metrics every month or quarter is time-intensive. Instead, optimise resources by automating the reporting process.
Several platforms automate reporting. Explore different tools, designs, visualisation charts and templates to decide the right one.
Next, connect the dashboard to data sources. These sources include CRM, Google Analytics, Social Analytics and Lead Management System.
To assess your actual progress over time, include historical data.
3. Optimise lead generation
Use the analyses or reports to understand where your leads are coming from so you can attribute them to the proper sources.
Marketing or lead generation channels, campaigns, ads, audience segments and keywords are some of the sources.
To identify the best-performing sources, track the journey of leads from first touch to purchase and after-sales. Then, you can adjust your resource allocation and budget towards high-performing lead generation sources.
You can also refine your lead generation strategy by focusing on leads with higher purchase intent.
4. Incorporate insights into marketing
Other than lead generation, also incorporate your dashboard insights into marketing.
Here's how you can do it:
- Set up your CRM to track customer relationships and preferences.
- Personalise your communication with leads and customers across multiple channels in the buyer journey.
- Conduct customer satisfaction surveys for firsthand feedback on customer experience with your products or brand.
- Set up a loyalty or referral program to offer rewards that customers want.
- Improve your service by including more maintenance options, extended warranties and streamlining customer-facing business processes.
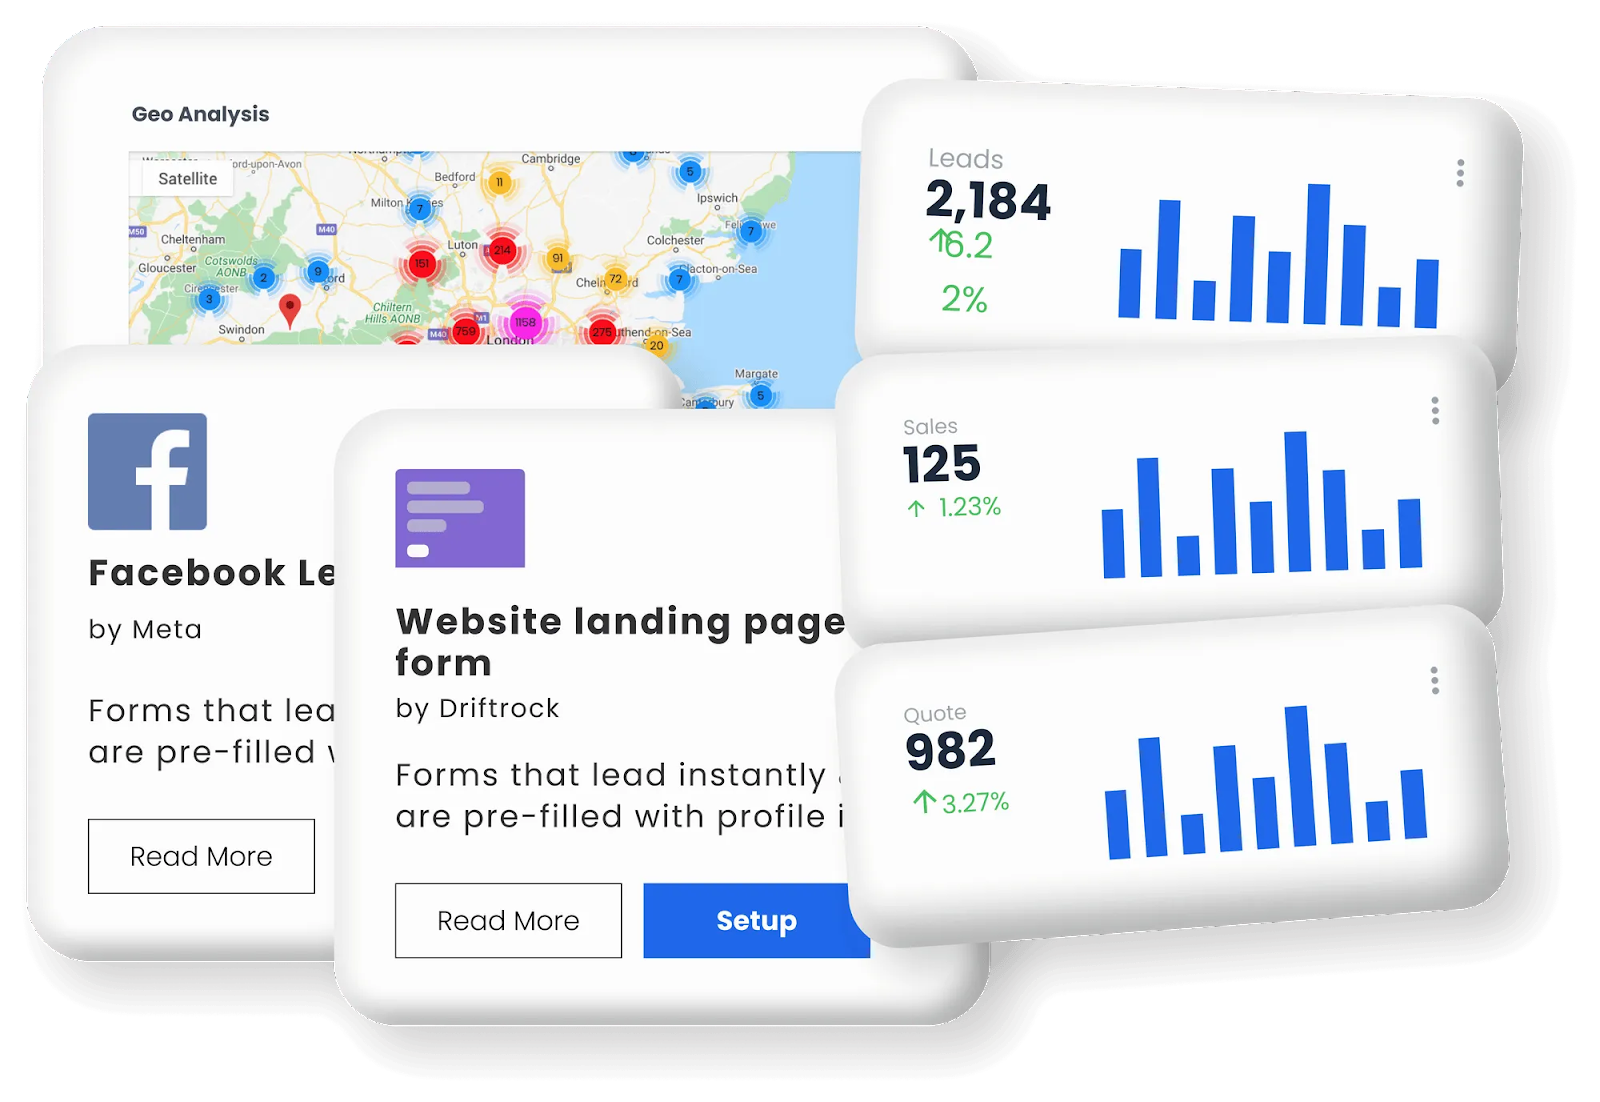
Get key automotive lead generation metrics under one roof
Even with a digital automotive marketing dashboard, you can spend too much time designing and connecting it to multiple data sources.
Driftrock automates the process and connects with multiple marketing lead generation sources in one place. You can track leads from keyword or ad set levels right until purchase.
Plus, you can include CRM data and offline conversions to monitor conversion and retention.
Find out how Driftrock can be the perfect automotive lead generation dashboard for you.