.svg)

Have you had a chance to look at the new Facebook Analytics product? If not, you need to. It is awesome.
Facebook Analytics enables you to enrich your audience data with more insights than ever before. You can do this by analysing your pixel data, or Facebook page data, to gain real Facebook audience analysis Insights.
Below are 6 great features we're just getting to grips with, through analysing pixel data.
Get interesting headline stats from Automated Insights
The first thing you see when you log in to Facebook Analytics is Automated Insights. These provide some interesting snapshots of information related to your campaign, that you might not previously have thought to look into.

For instance, look at the below above, which shows that for this specific Facebook pixel, People who live in France and who use a phone spent 36% more per user on purchases on your website compared to all users.
Who knew?!
Create a CUSTOM audience of your most valuable customers
This one is our personal favourite, and super-powerful when applied to your Facebook advertising.
At the top of the screen, you can set a filter of a specific audience that you would like to view data for. Below, you can see that we have set the web parameters condition to show data for anyone that has visited www.driftrock.com. (This filter is useful for any advertisers that are using their Facebook pixel on more than one domain). With this option, you are able to segment your pixel data by specific website.
You can then overlay a percentile - for instance the Top 25% of people who did this action most often or Top 25% of people whose actions were most valuable. If you have the Purchase event set up on your website, then this makes your Facebook audience analysis super easy. Now you start to see how valuable this audience can be.
Select your conditions, and click Apply. Now comes the awesome bit - check out the button in the top right hand corner Create Custom Audience. Yes, now you can build an audience of these high value customers, to target in your ad campaigns. And....guess what....did someone say lookalike audience...
Create a dashboard of your favourite reports
We love it when a tool lets you create your own dashboard of widgets. Google Analytics have been nailing this for years, and it is something that we have recently added to the Driftrock dashboard.

So anytime you see a particular Facebook Analytics report or widget that you will use frequently, simply pin it and it will show on your dashboard.
Run a cohort report
Cohort Reports are the holy grail of analysing your conversions. This enables you to analyse two events, and look at the time it takes people to move between one to the other.

So in the example above, we have selected Add to Cart and Purchase.
Analyse percentiles
Drill down into your most valuable audiences, and see exactly how many people are spending over a certain amount, or what percentage of your users spend the most.

Create and analyse your funnel
With the funnel analysis, you can spec out multiple steps in your funnel, and analyse the journey of your users.
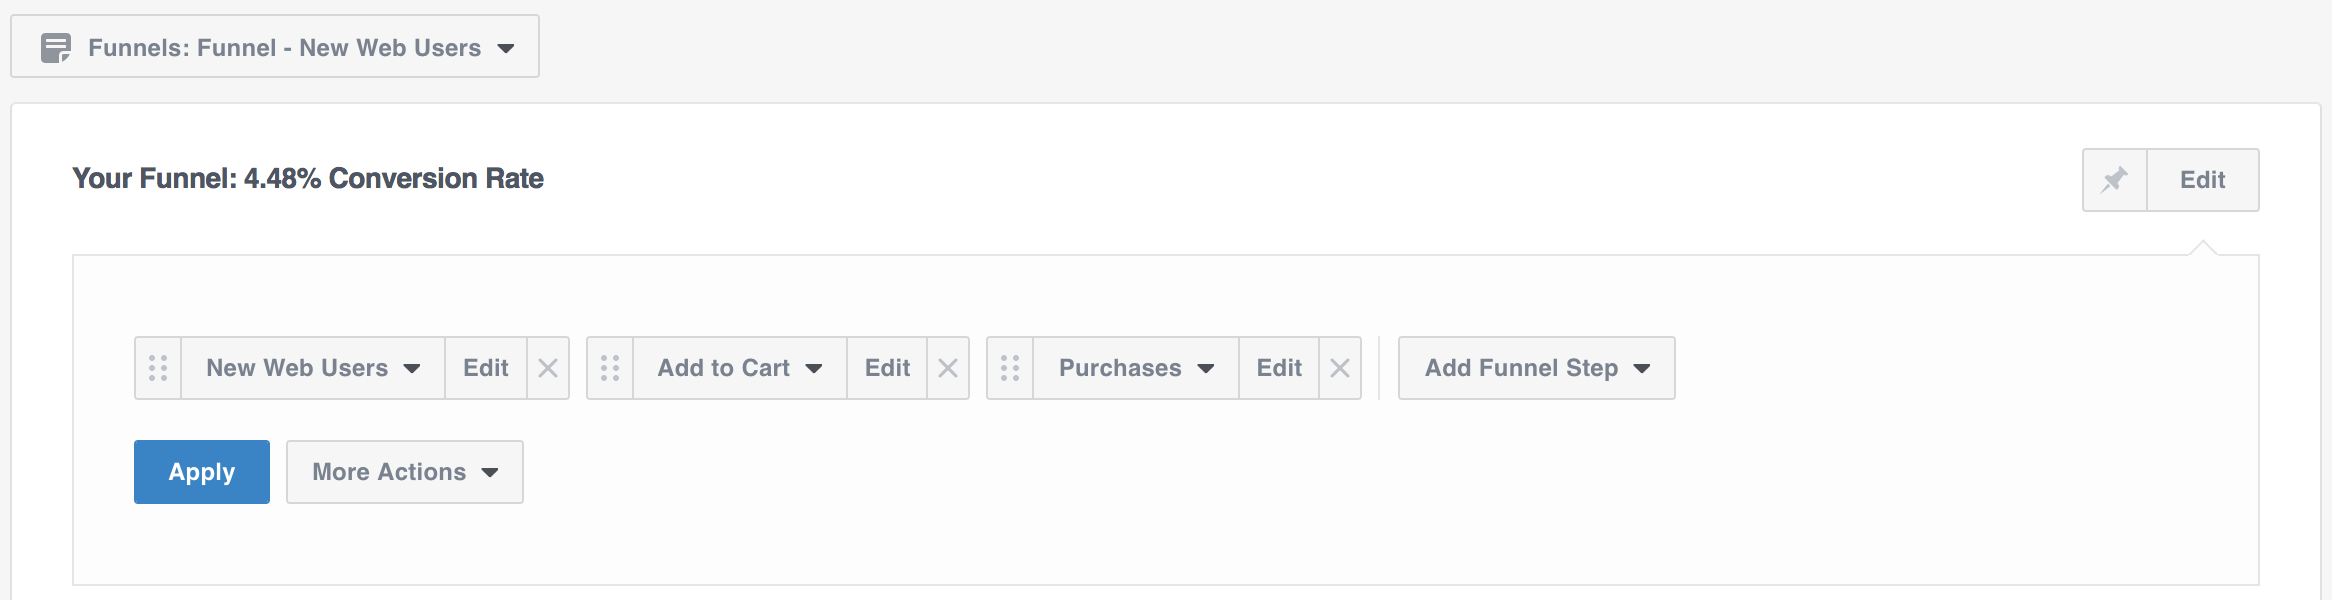
This enables you to spot where any drop-off points are, and investigate further any holes in your sales funnel.
Want to get started with Facebook Analytics? Head over to Facebook Analytics here.
Looking for hardcore funnel metrics? Find out how Driftrock can help you extend your downstream measurement even further, by getting in touch here: